


Welcome to the Monitorix project
Take control over your small server
News
14-Oct-2016
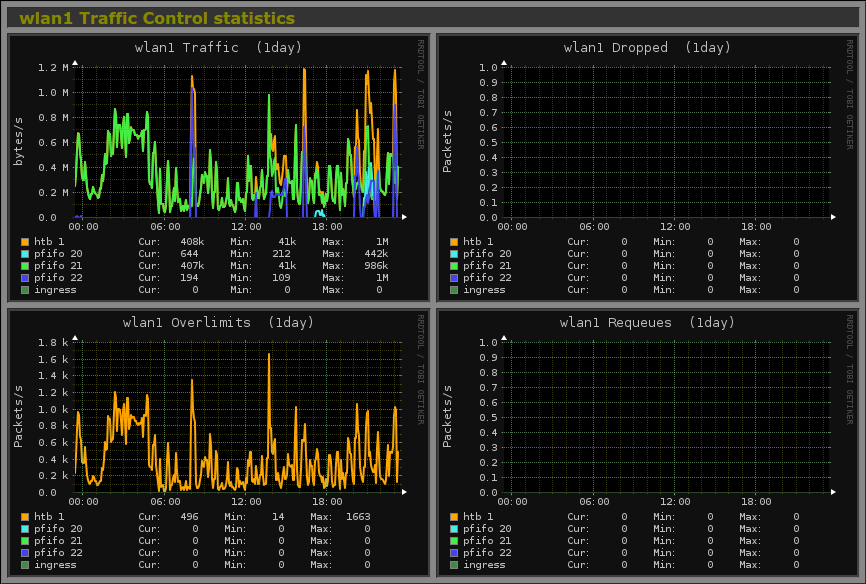
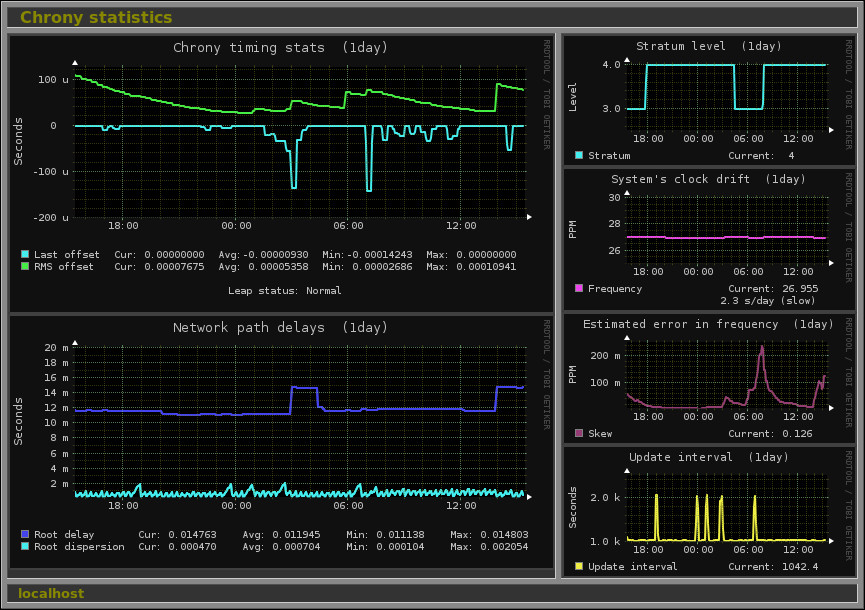
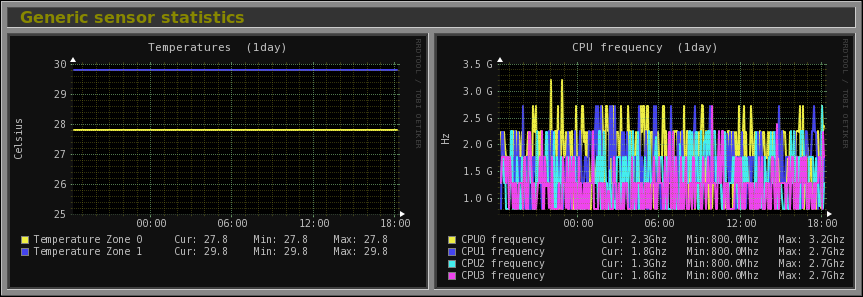
This new version introduces three more graphs and, as always, it also introduces new features and fixes some interesting bugs. The first new graph offers the possibility to monitor the network queue disciplines (qdiscs) associated to a network interface (also called Linux Traffic Control). The second graph monitorschrony,the new NTP daemon that comes with some newer Linux distributions. Finally the third new graph monitors these temperature and CPU frequency sensors that appear (depending on your motherboard) in the /sys/devices/ filesystem tree.
The following are examples of these new three graphs:
Besides all this the new version also includes interesting new features. From now on, you can monitor multiple disks and network interfaces of every virtual machine defined in the Libvirt graph. Another interesting new option is priority that lets you set the priority in which Monitorix will run. A new option called image_format lets you change the graphics format of the pictures generated by Monitorix. Also the new option enable_hourly_view lets you enable the hourly time frame although the resolution won't be specific for that time frame.
The rest of changes and bugs fixed are, as always, reflected in the Changes file.
Please, check the monitorix.conf(5) man page for all the details.
NOTICE: The configuration file monitorix.conf has been extended with important changes.


