


Welcome to the Monitorix project
Take control over your small server
News
25-Sep-2017
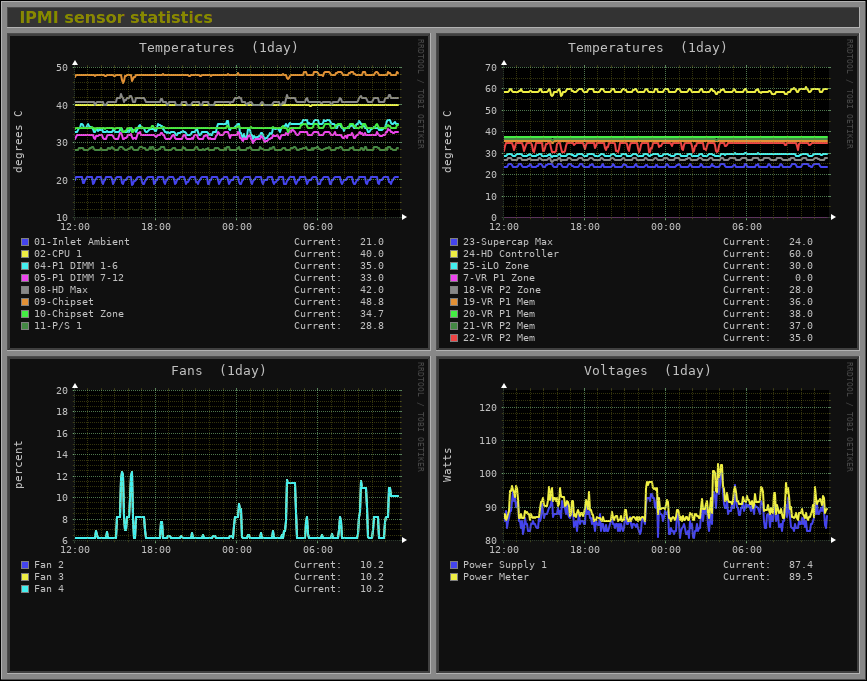
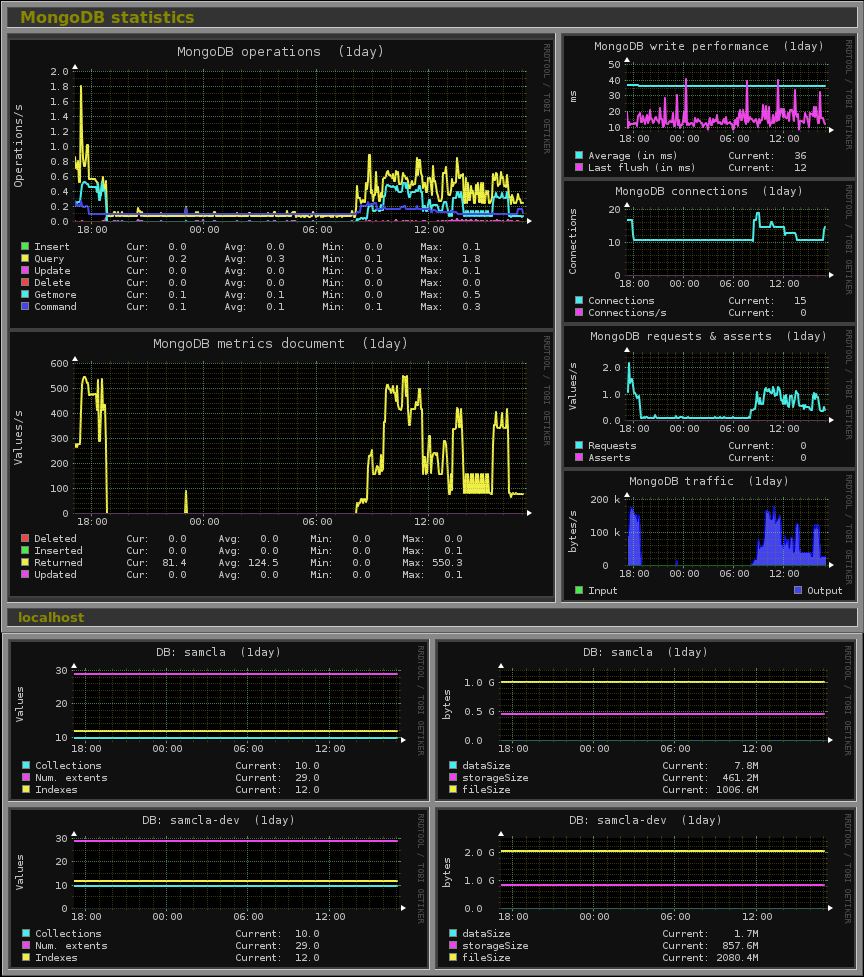
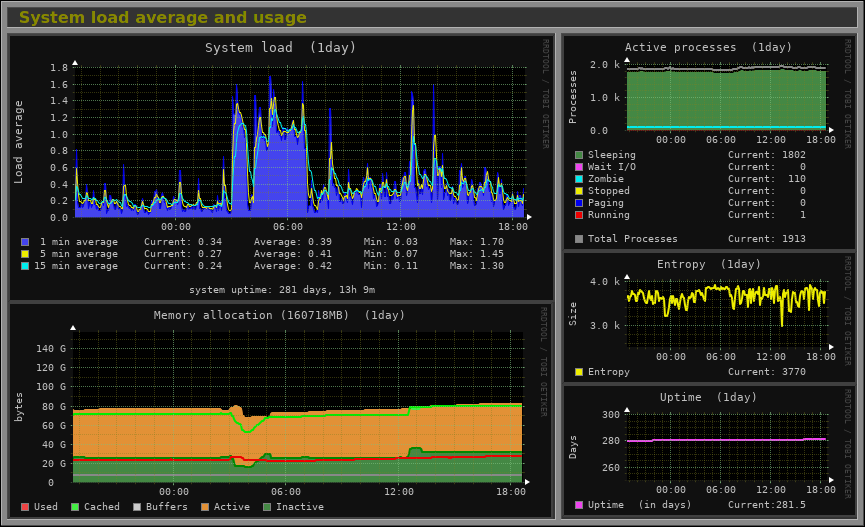
This new version introduces two new graphs and improves clearly an old one: the System graph. After a notable people demand, I've included a new graph to monitor IPMI sensors (temperatures, fans and voltages). The second new graph monitors an unlimited number of MongoDB servers (either local or remote). As said, the System graph has been improved and now it includes two new subgraphs: one that shows the system's entropy and another that shows the uptime of the system. The memory graph has also been enhanced including the values of memory active and inactive.The following are examples of these new three graphs:
Besides these new graphs, this version introduces a new option (enabled by default) called enable_parallelizing, which will speed up dramatically the graph generation in multi-core systems. This should also benefit people using Monitorix in Raspberry Pi systems and similar with multi-core processors. I'll be glad to get some feedback on this.
More news, since now all graphs that show sensors will include an alert capability to be able to execute an external shell script if the value of a sensor exceed an specific threshold.
The rest of new features, changes and bugs fixed are, as always, reflected in the Changes file.
Please, check the monitorix.conf(5) man page for all the details.
NOTICE: The configuration file monitorix.conf has been extended with important changes.


