


Welcome to the Monitorix project
Take control over your small server
News
16-Sep-2015
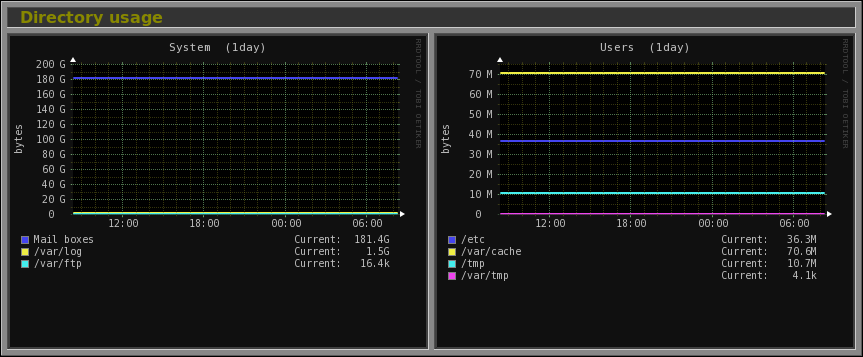
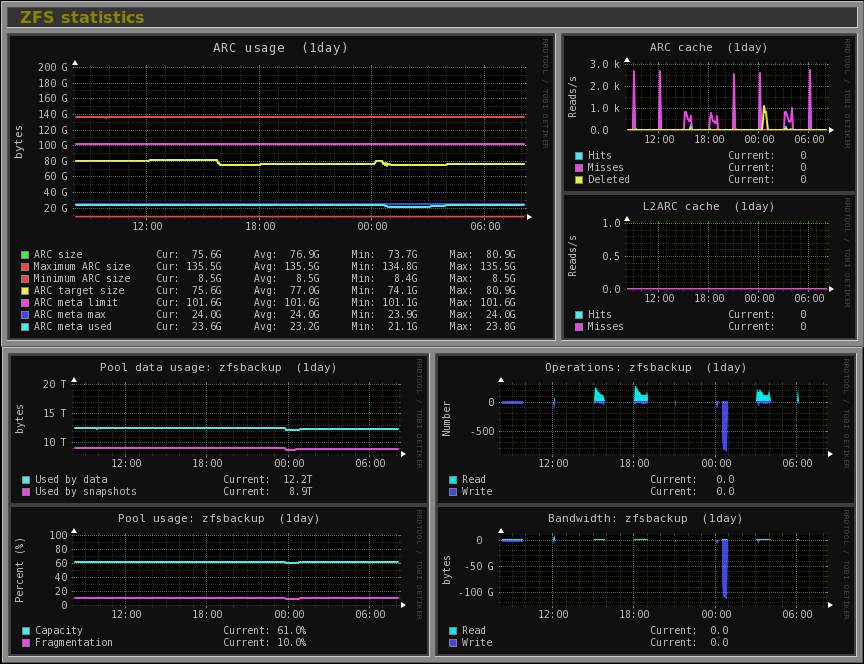
This new version introduces four new graphs and a number of new features, (of course, lots of bugs were also fixed). The first new graph shows the directory usage (based on the output of thedu command) from a list defined in the configuration file. This is really useful when you want to keep an eye on the size of some specific directories. The second one is a ZFS statistics graph, which is specially useful for these people using such special file system in their servers. It can monitor an unlimited number of pools.
The following are examples of the new directory usage and ZFS graphs:
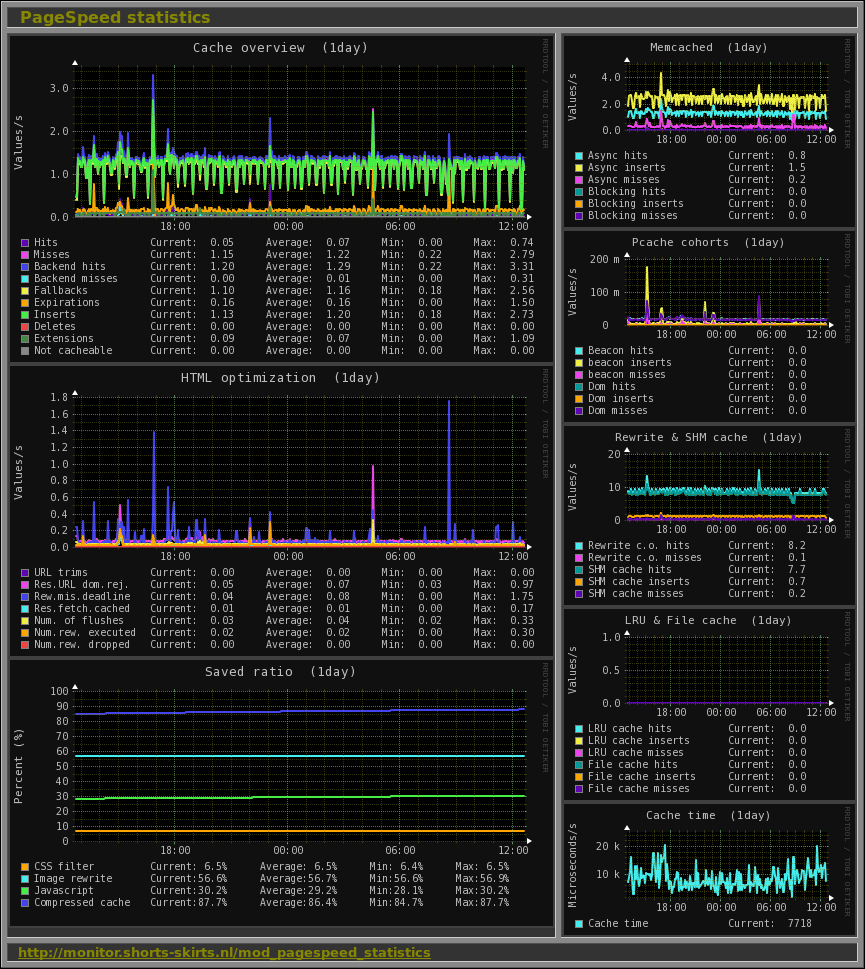
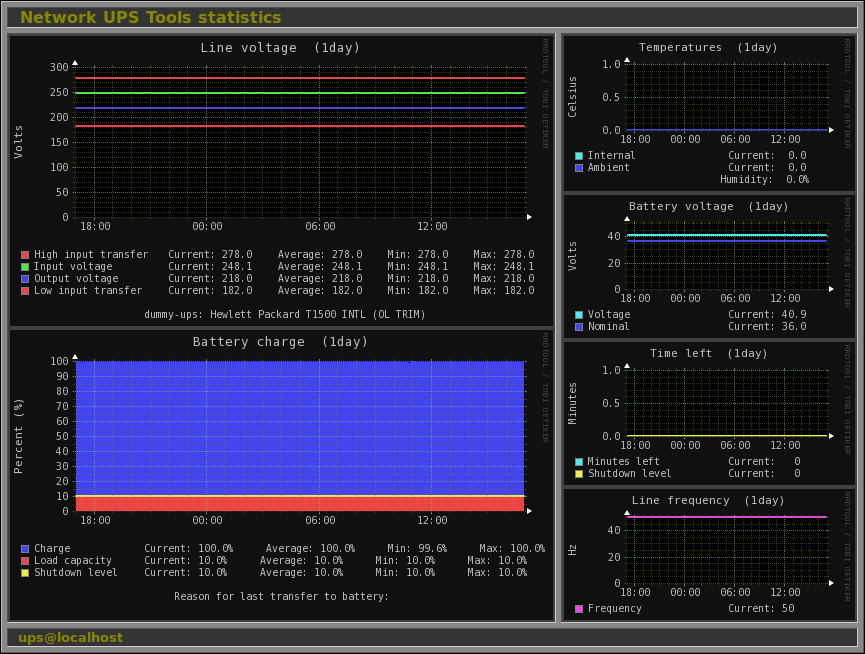
The other two graphs are: one that monitors the PageSpeed Module, from Google developers, and the other one that monitors Network UPS Tools (NUT) devices. Both graphs also support unlimited monitorization on their own.
The following are examples of the new PageSpeed and NUT graphs:
Besides all these graphs this new version also includes interesting new features. The alert capabilities in the Filesystem graph have been changed and now it supports the ability to include an independent alert for each filesystem defined. The Apache graph has extended with more information and it also has new support for alert capabilities based on the remaining free slots.
The rest of changes and bugs fixed are, as always, reflected in the Changes file.
Please, check the monitorix.conf(5) man page for all the details.
NOTICE: The configuration file monitorix.conf has been extended with important changes.


