


Welcome to the Monitorix project
Take control over your small server
News
12-Mar-2015
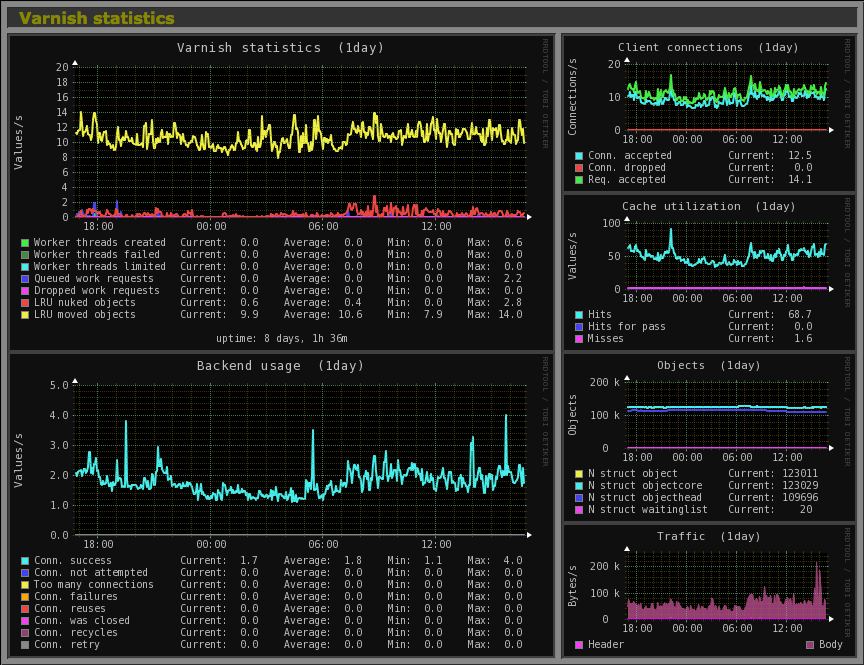
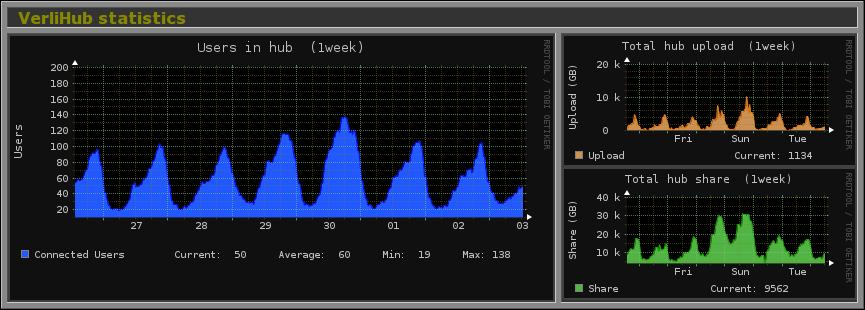
Another new version that introduces two new graphs; the first one is a new Varnish cache statistics graph which hopefully covers all the most important values. It was created using the Varnish version 3.0.6, so I hope it will be also compatible with the new 4.0 version. The second graph covers the Verlihub statistics and was developed and provided by an external user.The following are examples of the new Varnish and Verlihub graphs:
As always this version also includes a number of changes and new features, and of course more bugs were fixed. The zoomed graphs now honour the global_zoom option and also fit much better in the browser pop up window. The Ports graph now includes the options tcp6 and udp6 to be able to monitor IPv6 connections. The Process graph now detects better the process names using the command parameter in the ps command. And more.
The rest of changes and bugs fixed are, as always, reflected in the Changes file.
Please, check the monitorix.conf(5) man page for all the details.
NOTICE: The configuration file monitorix.conf has been extended with important changes.


