


Welcome to the Monitorix project
Take control over your small server
News
20-Aug-2014
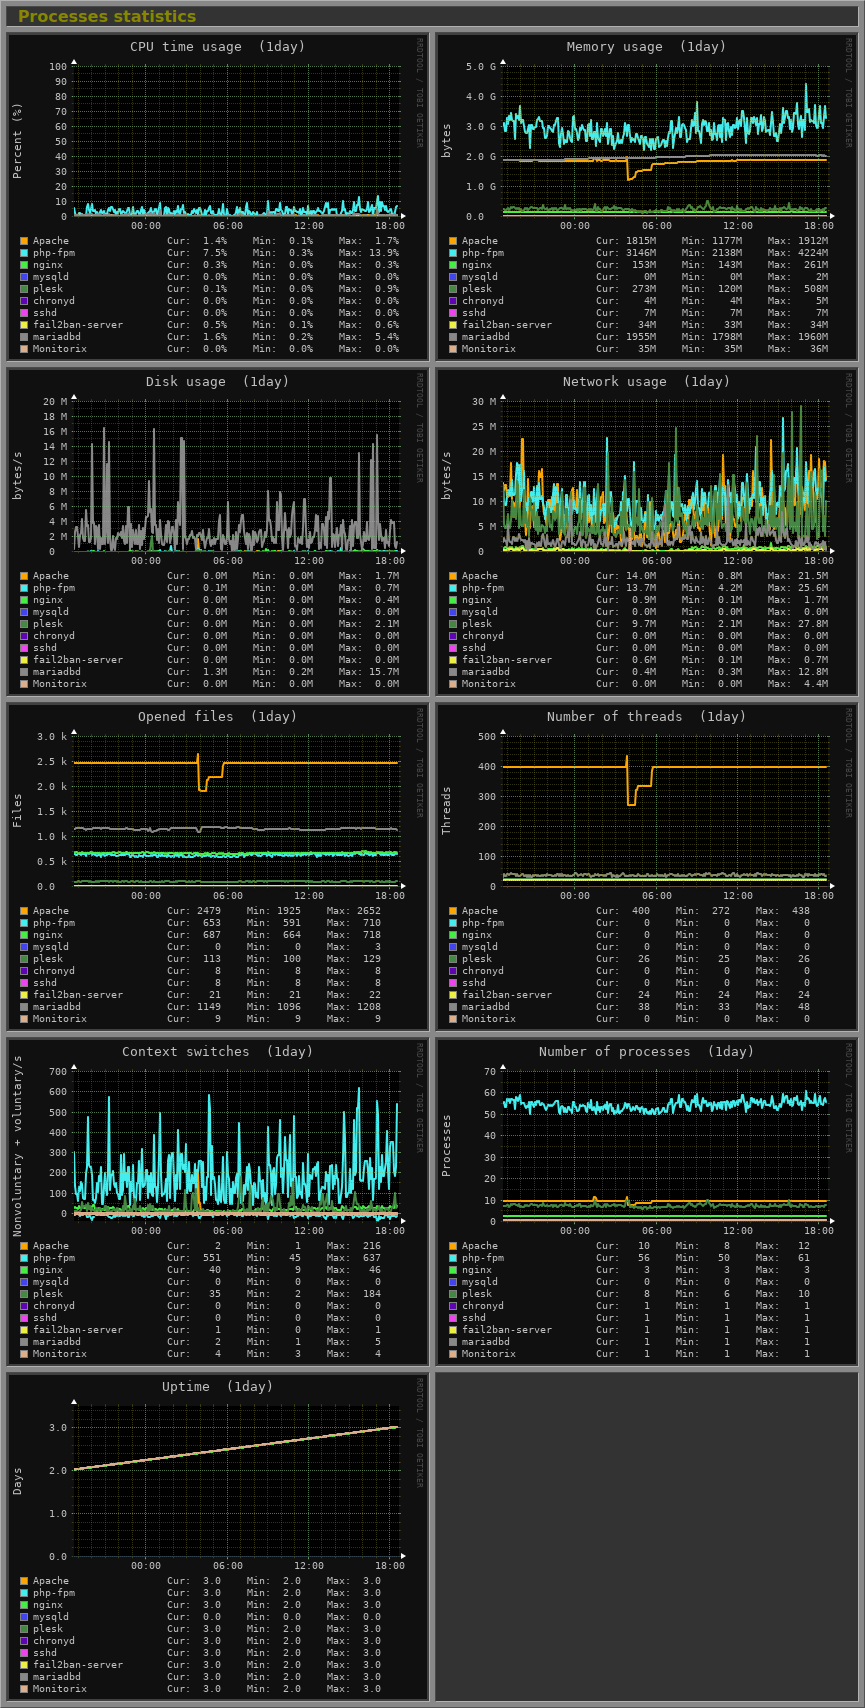
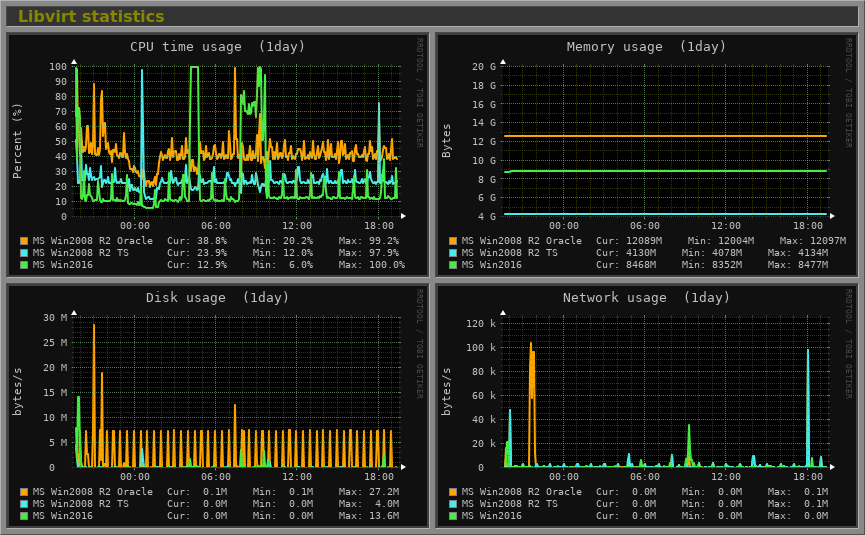
This new version introduces two new graphs; one that is Linux specific to monitor an unlimited number of user processes (including CPU usage, memory usage, disk usage, network usage, opened files, number of threads, number of voluntary and involuntary context switches and number of instances of the same process). The other new graph is to monitor also an unlimited number of virtual machines (using thelibvirt manager) and also covers CPU, memory, disk and network usages.
The following are examples of the new Process and Libvirt graphs:
This version also includes a number of changes and new features, and of course a number of bugs were fixed. There is a new option called ip_default_table to instruct Monitorix to use a specific iptables table for network traffic accounting. This should help to avoid conflict with some firewalls running in the same machine.
The Mail graph now includes a graph that shows the SPF results in real time (right now it only supports the output of smf-spf tool). This new version also adds support for the latest Nvidia driver 340.24, it also extends the functionality of limit and rigid options, reducing a lot of code at the same time and changed the DST values in the Network interface graph which should avoid (finally!) these annoying unexpected huge peaks in the graph.
It also includes some fixes in order to reduce CPU load on servers with big log files.
The rest of changes and bugs fixed are, as always, reflected in the Changes file.
Please, check the monitorix.conf(5) man page for all the details.
NOTICE: The configuration file monitorix.conf has been extended with important changes.


