


Welcome to the Monitorix project
Take control over your small server
News
14-Mar-2019
Important notice for people that is still using versions 3.10.0 or older: This one fixes a cross-site scripting (XSS) vulnerability that was already announced and fixed in the 3.10.1 version.
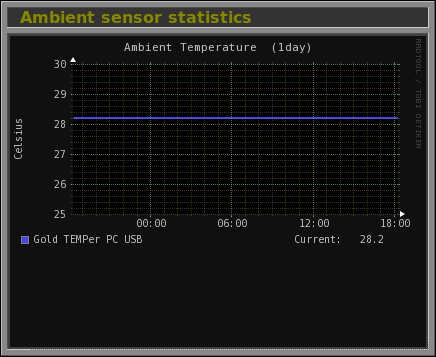
This new version introduces one new graph: the Ambient Sensors graph. This graph is intended for gathering temperature values from any kind of external sensors. Each defined sensor is associated to a command line that will be executed by Monitorix to get the temperature. It also support alerts to notify when the value is above or below from a defined threshold.
The following is an example of this new graph:
Besides the fact that this new version only comes with one new graph, it really includes interesting new features. One of the most important is the new option 'autocheck_responsiveness' (enabled by default), that hopefully should fix those so annoying hangups in the HTTP built-in server.
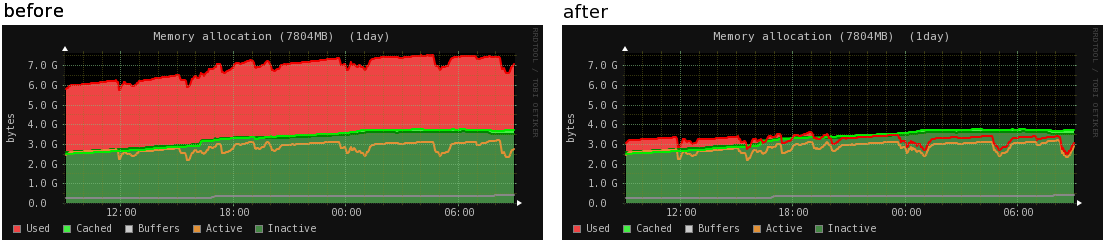
Another interesting change is the new way of how the memory graph will be shown in Linux systems. The value used will be recalculated as used = MemTotal - MemFree - Buffers - Cached - SReclaimable - SUnreclaim which will ensure that Monitorix will be in sync with the Used column in the output of newer free command, and with the -/+ buffers/cache row of the older free command.
The following is an example that shows how this graph has changed in this new version:
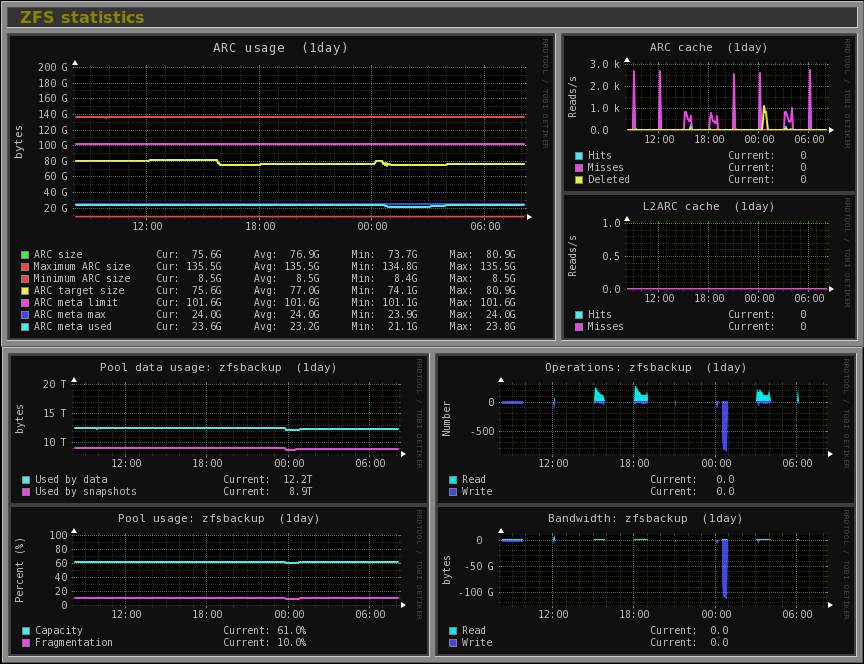
The ZFS graph has also changed, it now includes more information for each pool defined with the number of operations and the bandwidth used.
The following is an example that shows the new ZFS graph:
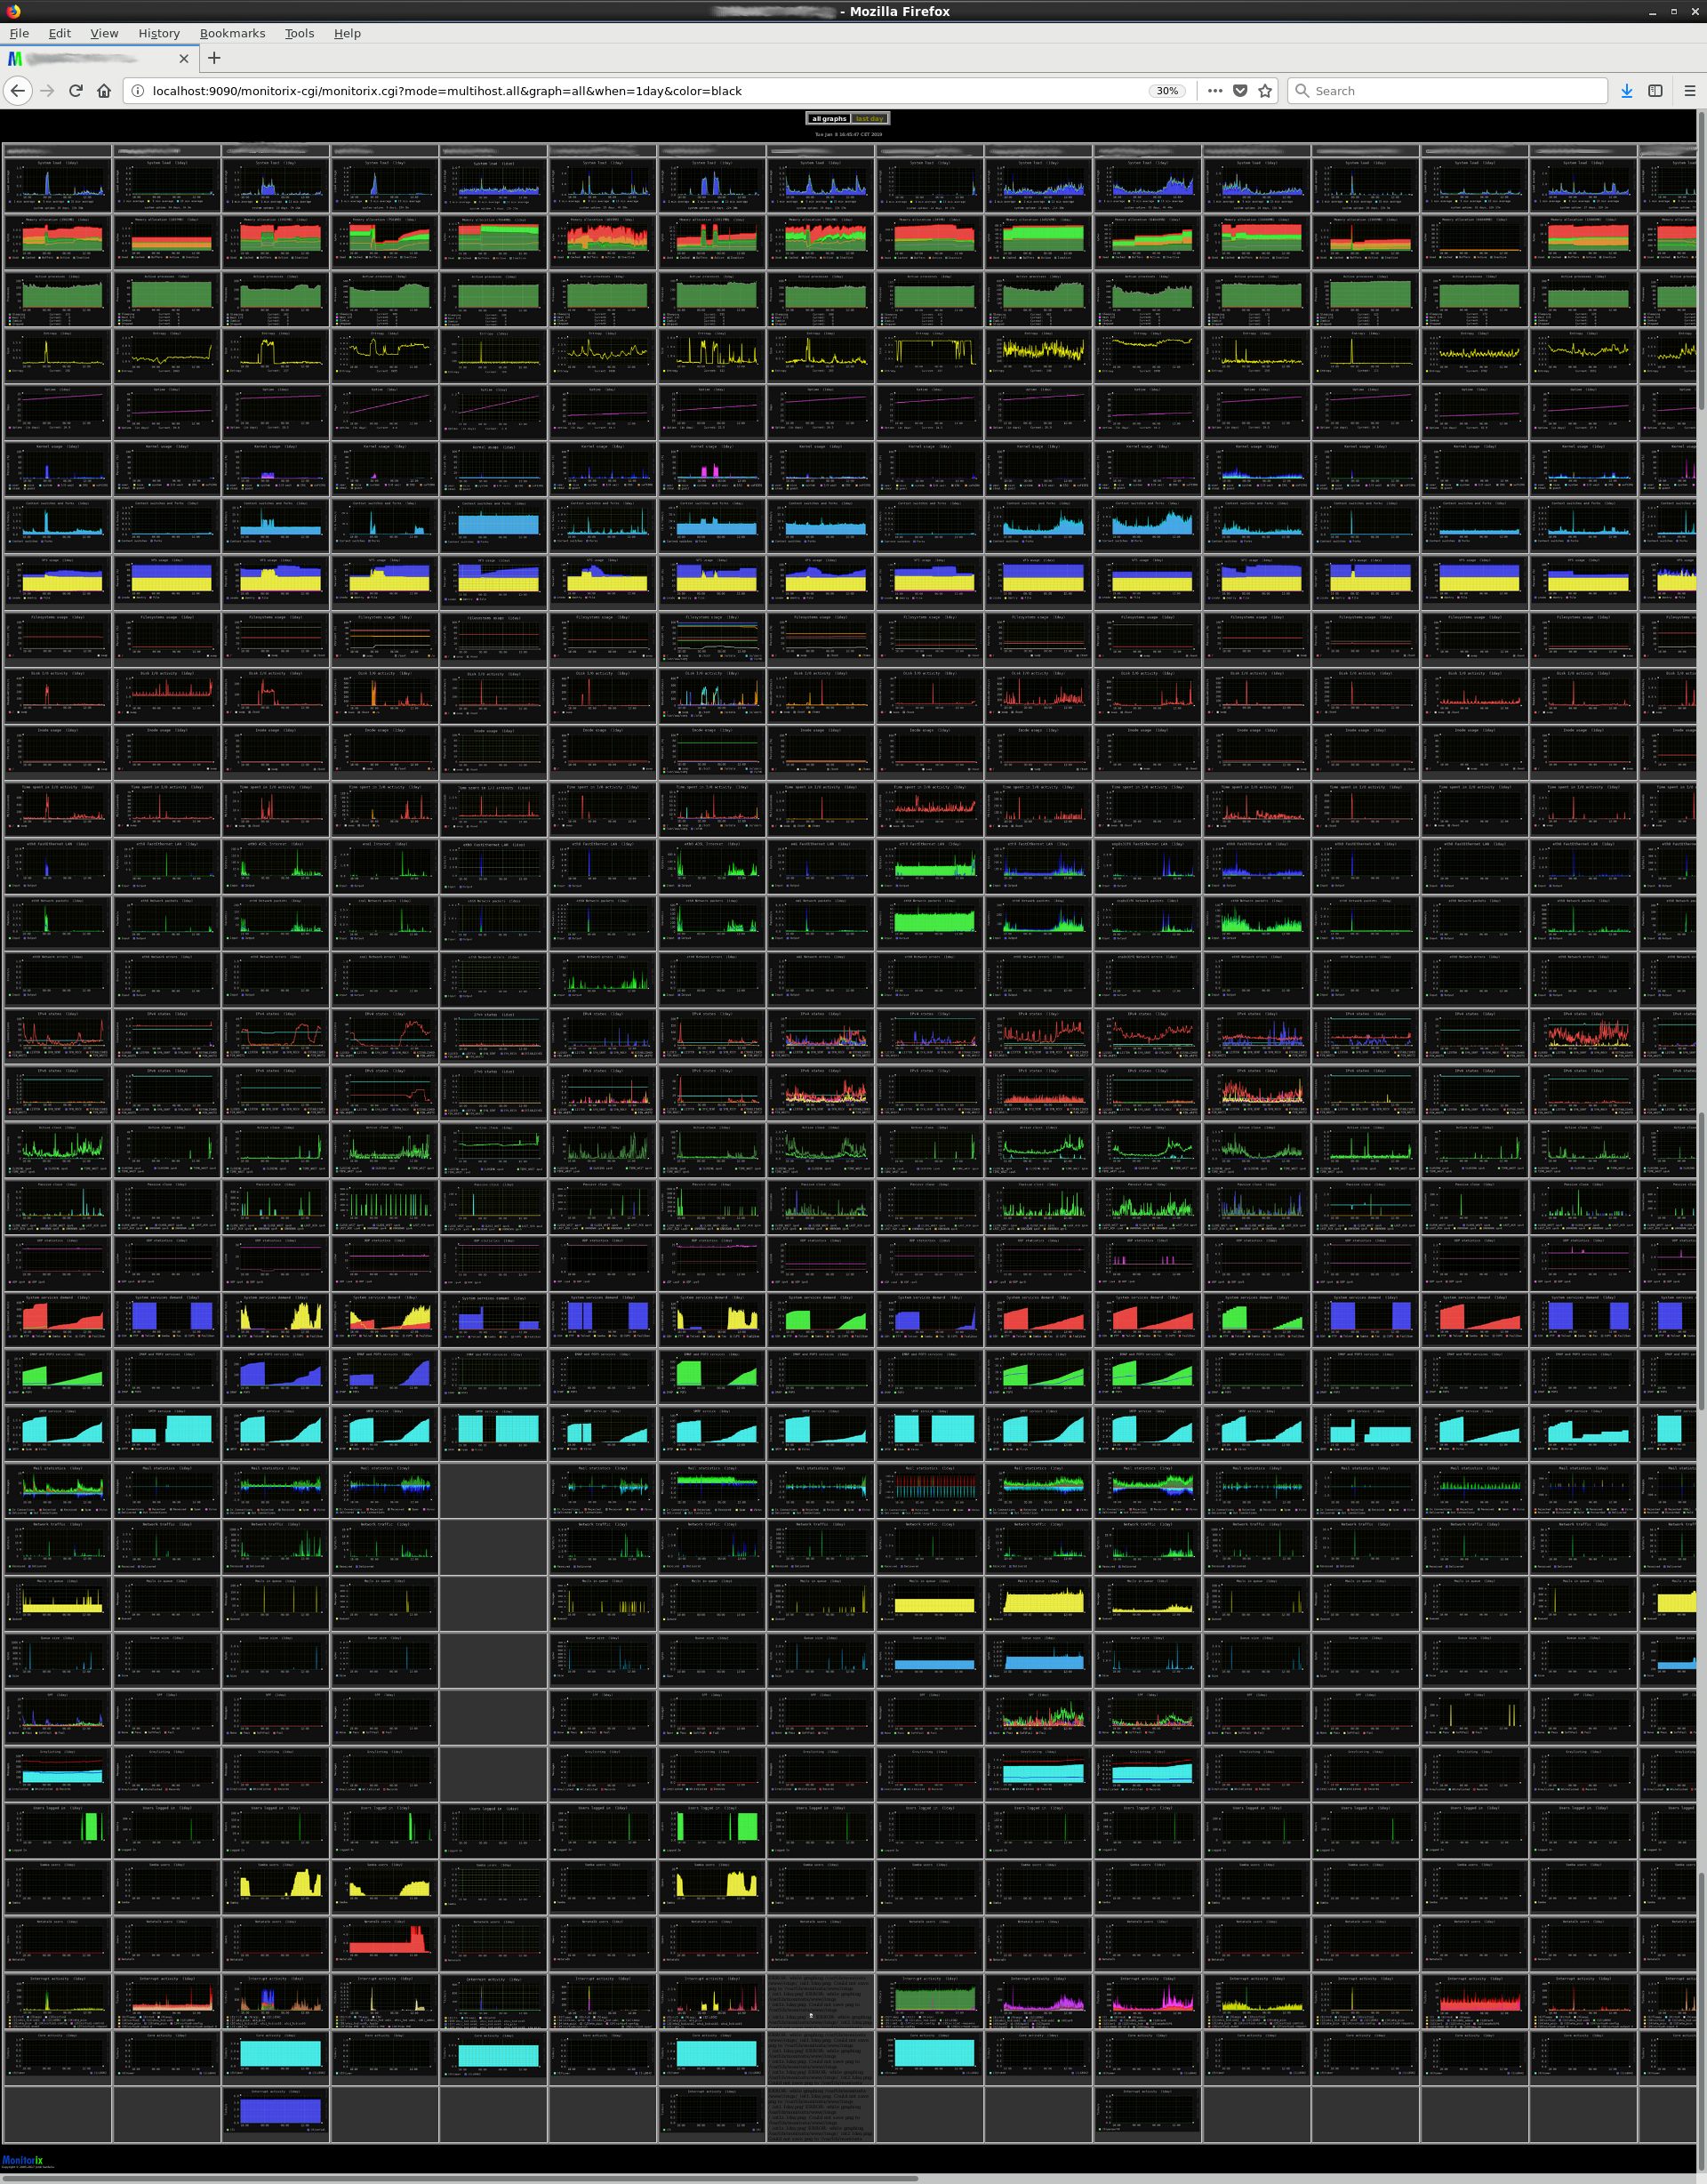
By popular demand, I've finally included in Multihost mode the ability to show all graphs of a single server and even all graphs from all remote servers. In the later case, you must keep in mind that in order to see all graphs, the remote servers must have the same configuration file than the host from where you are viewing them all.
It's important to notice that this new feature has a potential risk if there is defined a considerable amount of remote servers and the user selects the option "All" in the Hostname list and "All graphs" in the Graph list. This is something that may happen now accidentally and the browser may hang for a while due to the huge amount of images to download remotely from different servers.
In order to prevent precisely that, this new feature comes with a new option called default_option_when_all that defines which option in the Graph list ('System load" by default) will be selected automatically when the user selects 'All' in the Hostname list. Of course, the user is still able to change it to "All graphs" at any moment, and at his own risk :-).
In the following picture you can see how you'd look all graphs at once of more than 20 remote servers. As you can see, there are some missing pictures in the fifth remote server because such server don't has enabled the graph in question.
The rest of new features, changes and bugs fixed are, as always, reflected in the Changes file.
Please, check the monitorix.conf(5) man page for all the details.
NOTICE: The configuration file monitorix.conf has been extended with important changes.
All users still using older versions are advised and encouraged to upgrade to this version.


