


Welcome to the Monitorix project
Take control over your small server
News
12-Aug-2013
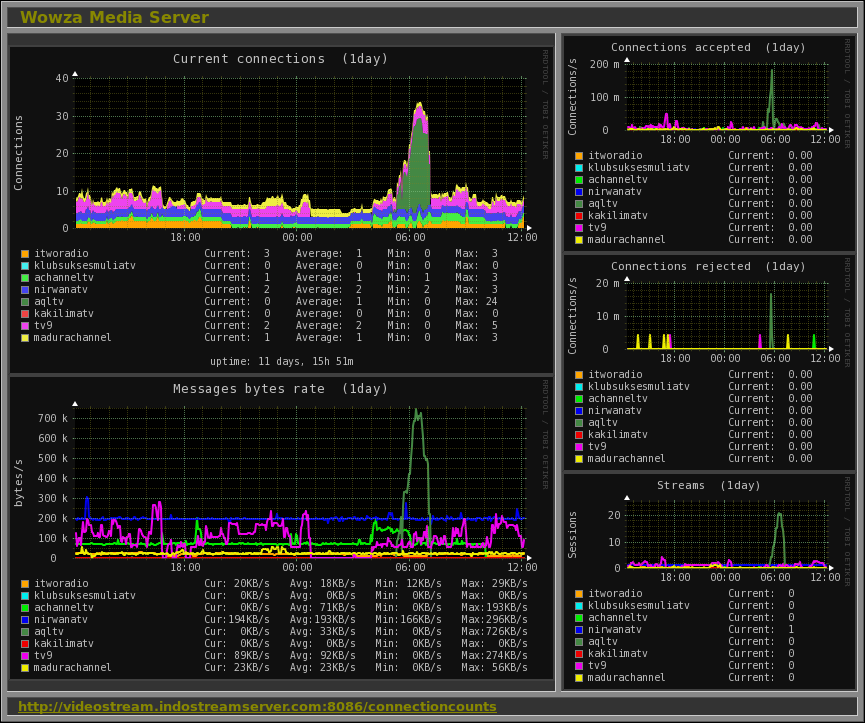
This version introduces mainly two new graphs; one to monitor an unlimited number of Wowza Media Servers and another to monitor an unlimited number of Alternative PHP Cache installations either in local or remote web servers.The Wowza graph is able to monitor up to 9 applications per server and it shows the current number of connections, the messages bytes rate, connections accepted/refused and the number of sessions of the streams. The following is an example of the new Wowza graph:
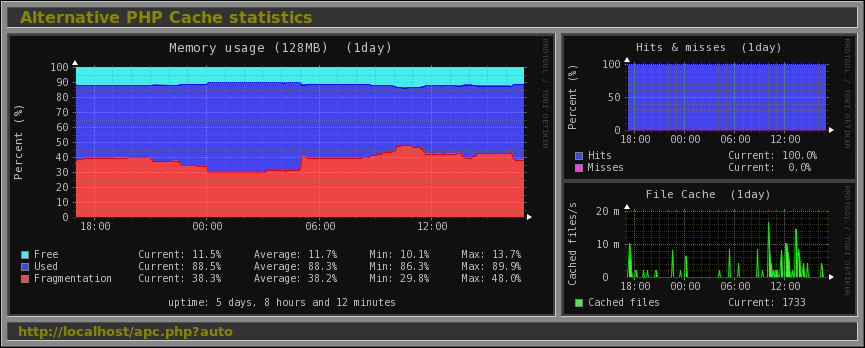
The PHP-APC monitorization graph includes the current memory usage (free, used and fragmentation), the percentage of hits and misses, and the number of files cached per second and accumulated. The following is an example of the new PHP-APC graph:
This new release also includes a complete email reporting mechanism for those system administrators who prefer receive graphs via email instead of using a web browser. It also includes a reimplementation of the alarm signal handler that helps to fix a complete freeze of Monitorix if the network goes down while monitoring NFS filesystems.
The are some new interesting options that help to make daily system monitorinng more comfortable. The rest of changes and bugs fixed are, as always, reflected in the Changes file.
IMPORTANT NOTICE: The configuration file monitorix.conf has been extended with important changes.
All users still using older versions are encouraged to upgrade to this one.


