


Welcome to the Monitorix project
Take control over your small server
News
13-May-2013
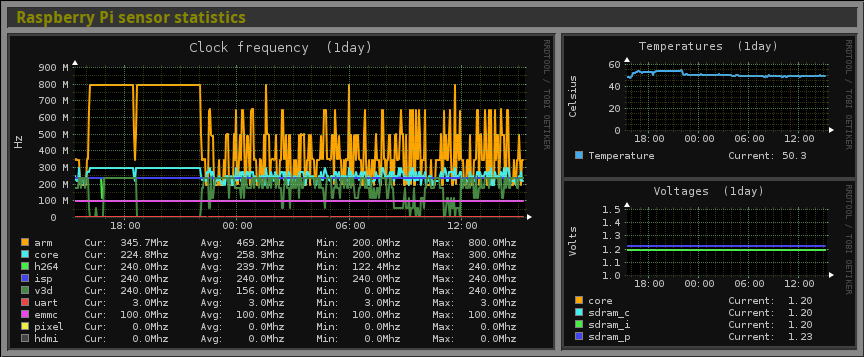
This version introduces a new major feature, a new graph to monitor the sensors of a Raspberry Pi card, which includes its clock frequencies, temperature and voltages. This graph requires to have installed the commandvcgencmd that should come with the Raspberry Pi firmware.
The following is an example of the new Raspberry Pi graph:
My special thanks to graysky for his suggestion to add this new graph and for his assistance during all the process.
Another important new feature is support of ATI cards in the lmsens graph, which will be able to display its temperature. As in the NVIDIA case, it requires the ATI official drivers.
It also includes the new option temperature_scale to be able to toggle between values in Celsius or in Fahrenheit in all graphs that show temperatures.
The rest of changes and bugs fixed are, as always, reflected in the Changes file.
Please, check the monitorix.conf(5) man page for all the details.
IMPORTANT NOTICE: The configuration file monitorix.conf has been extended with important changes.


