


Welcome to the Monitorix project
Take control over your small server
News
28-Nov-2011
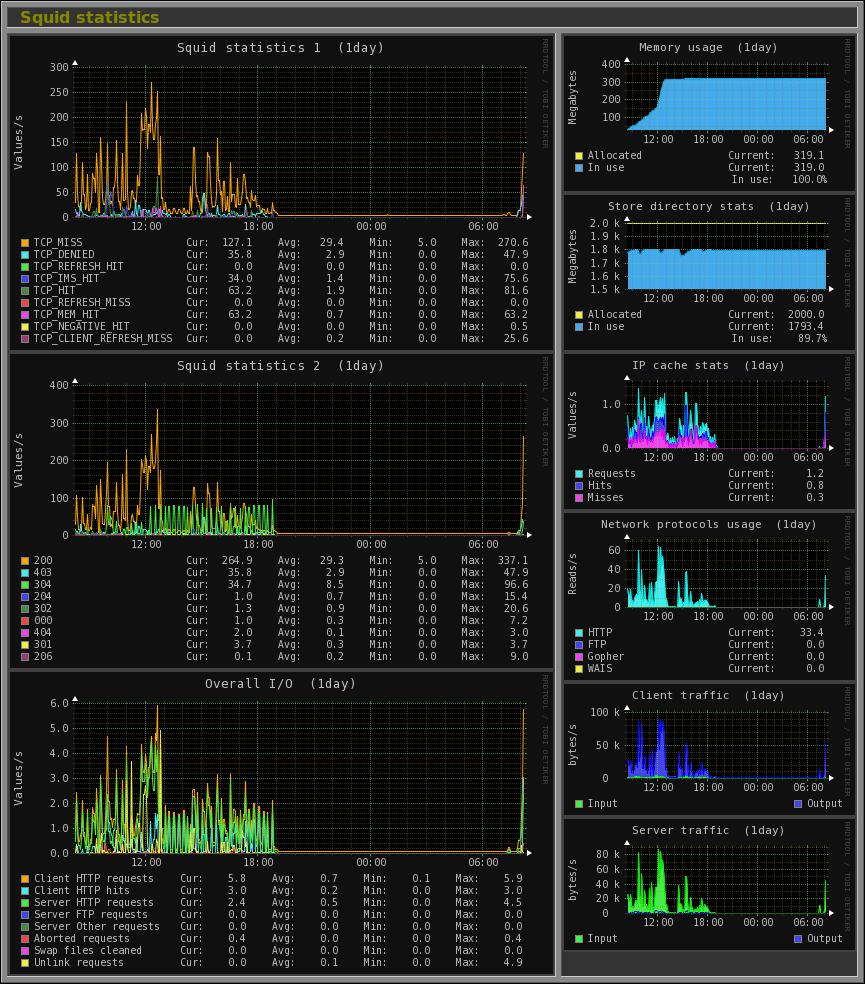
This version introduces three new graphs to monitor the Squid Proxy Web Cache, the NTP server and the Icecast Streaming Media Server. All graphs have been created following the classical Monitorix layout while, at the same time, attempting to be as much complete as possible.The Squid graph includes a pretty complete statistics covering up to 18 result and status codes, memory and storage usage, network protocols usage, client and server network traffic and more.
The following is an example of the new Squid graph:
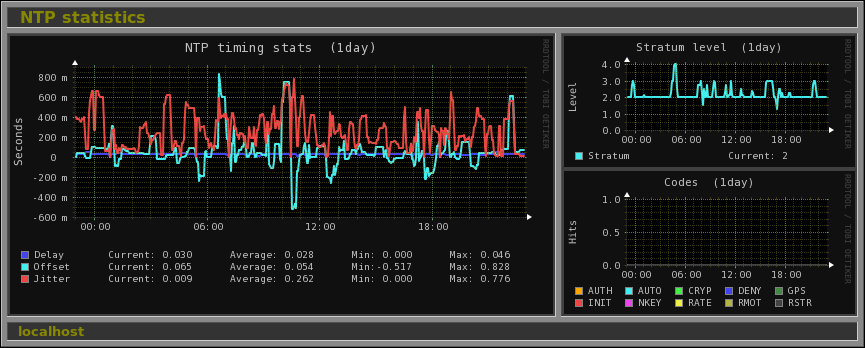
The NTP graph includes monitoring for Delay, Offset and Jitter values, the Stratum level and the Reference Identifier codes including the Kiss-o'-Death codes. It's is able to monitor up to unlimited NTP servers.
The following is an example of the new NTP graph:
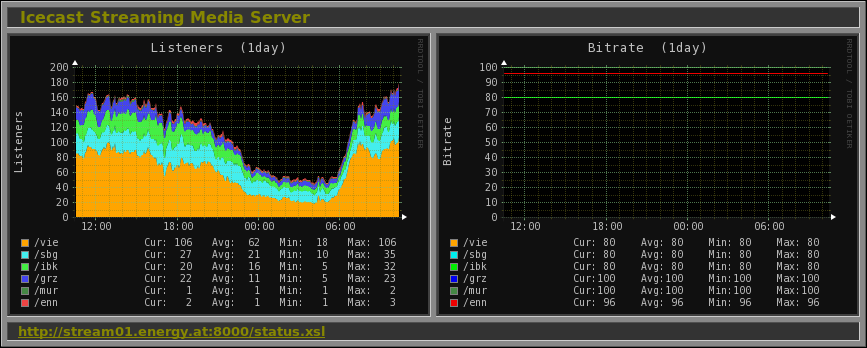
The Icecast graph includes monitoring of the Current Listeners and the Bitrate for each mountpoint defined, and it is also able to monitor up to unlimited Icecast servers.
The following is an example of the new Icecast graph:
These new graphs maintain the two modes (text and graph) in order to continue my commitment with those blind people or people with vision impairments that use Screenreaders software to interact with the computer.
Please, check the monitorix.conf(5) man page for all the details.
Other highlights of this release include the support for network port monitoring and Nginx network traffic monitoring on FreeBSD and OpenBSD systems.
The rest of changes and bugs fixed are, as always, reflected in the Changes file.
IMPORTANT NOTICE: The configuration file monitorix.conf has been extended with important changes.


