

Welcome to the Monitorix project
Take control over your small server
News
21-Dec-2010
After some time working, I wanted to show what are the latest news of the current development of Monitorix 2.0:serv.rrd
This is the graph that was called previously asservu.rrd. This graph continues being refreshed every 5 minutes but it has suffered a number of changes. The most relevant is that all the data regarding SMTP has been shifted to the bottom right graph including the Spam and Virus emails. This change has permitted that the following new values appear in the main graph:
- Number of IMAP logins (Dovecot and UW-IMAP are the only servers supported right now).
- Number of printer jobs (CUPS).
$SERV_MODE has been included to have the ability to change the way how the data is represented; either as cumulative results or as load results.
mail.rrd
Nothing new in this graph, only some legend adjustments and more values shown in the Greylisting graph.port.rrd
Several new features have been included to this graph. One of the most relevant is the new option called$PORT_MAX which defines the number of network ports being monitored.
Another interesting new feature and long awaited is the ability to choose the network protocol used in the port monitoring (tcp, upd, etc.)
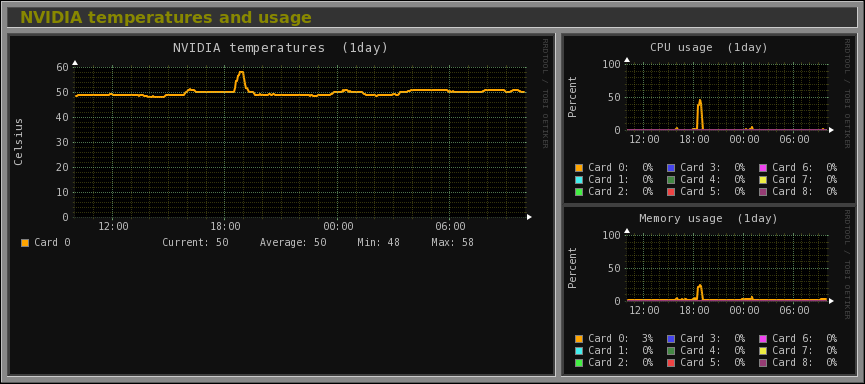
nvidia.rrd
This is a completely new graph suggested by graysky. It will be useful for those people using CUDA for advanced processing with multiple NVIDIA cards installed. It shows the following information:- Temperatures of up to 9 NVIDIA cards.
- GPU usage of up to 9 NVIDIA cards.
- Memory usage of up to 9 NVIDIA cards.
The following is a screen shot of the new graph: