

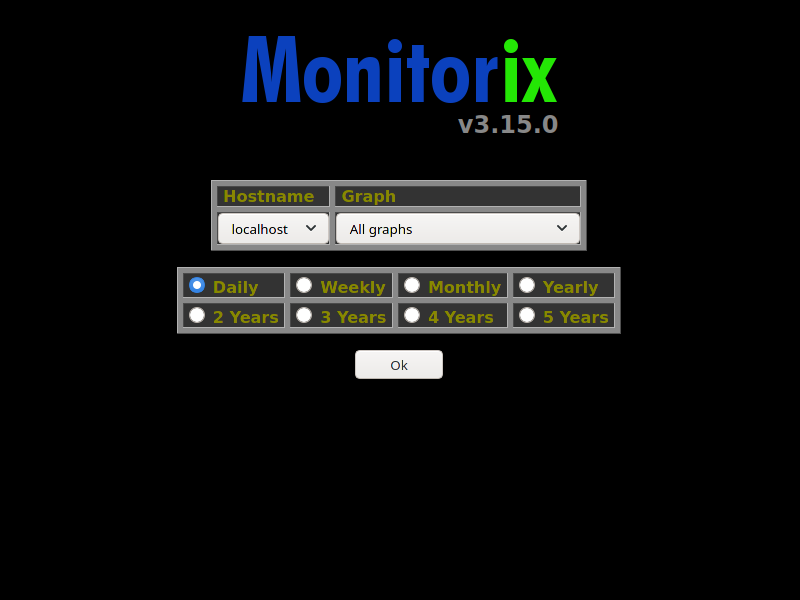
Welcome to the Monitorix project
Take control over your small server
Screenshots
Monitorix main page using the default black theme. |
|
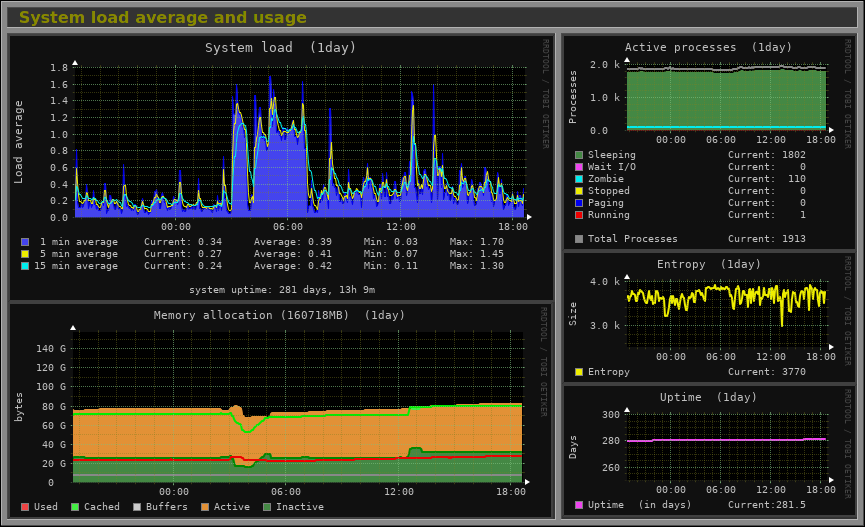
System load average, active processes and memory allocation. |
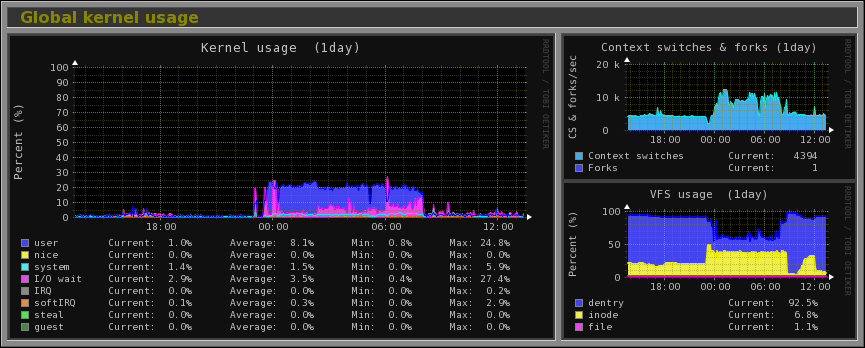
Global kernel usage. |

Per-processor kernel usage. |
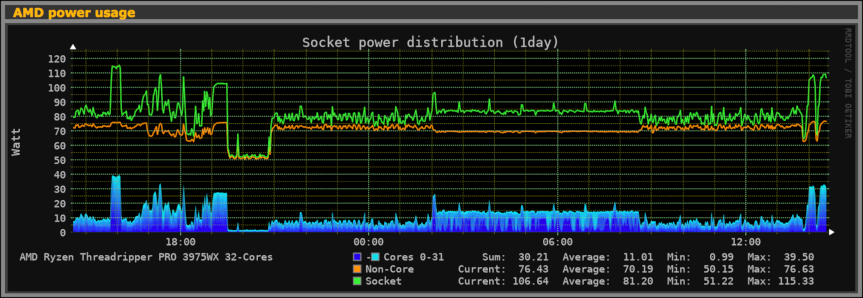
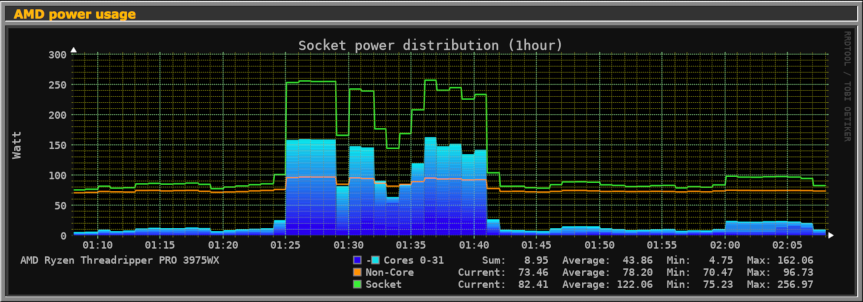
AMD CPU power consumption. |
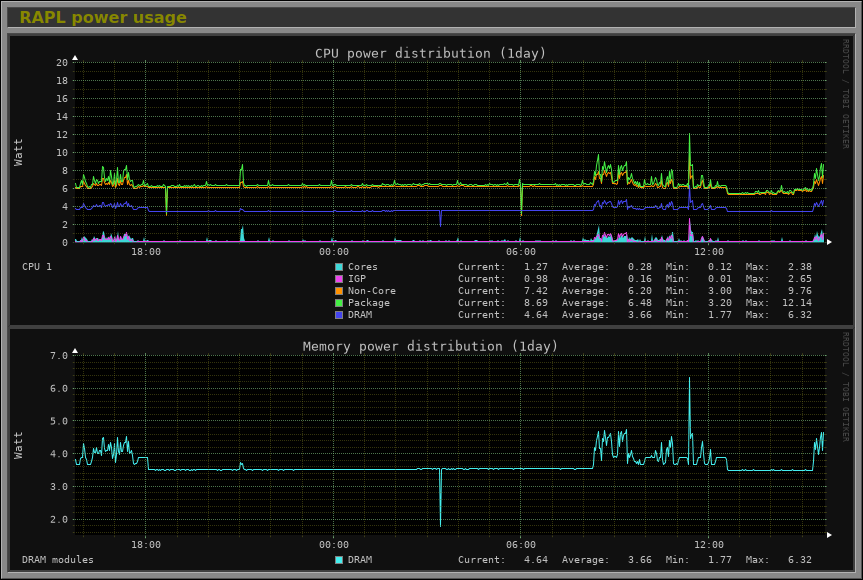
Intel RAPL power consumption. |
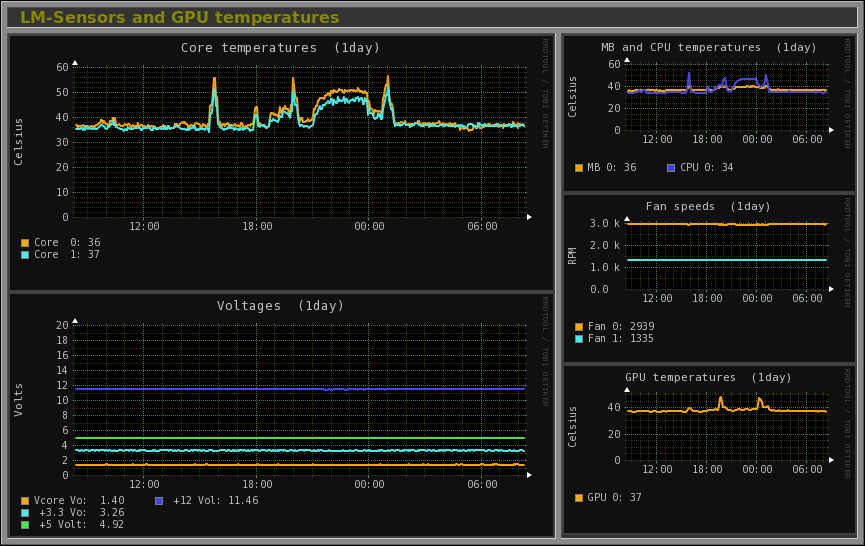
Complete LM-Sensors and GPU temperatures. |
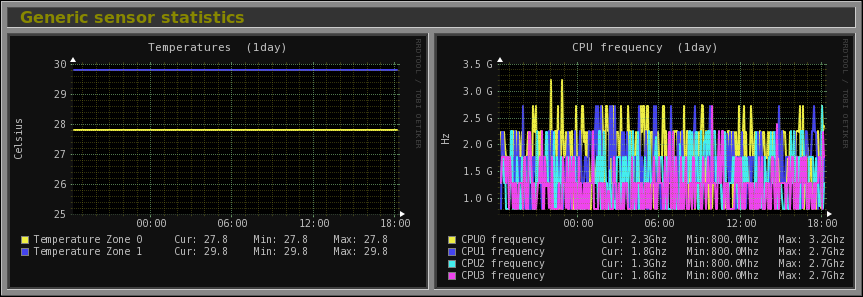
Generic sensors. 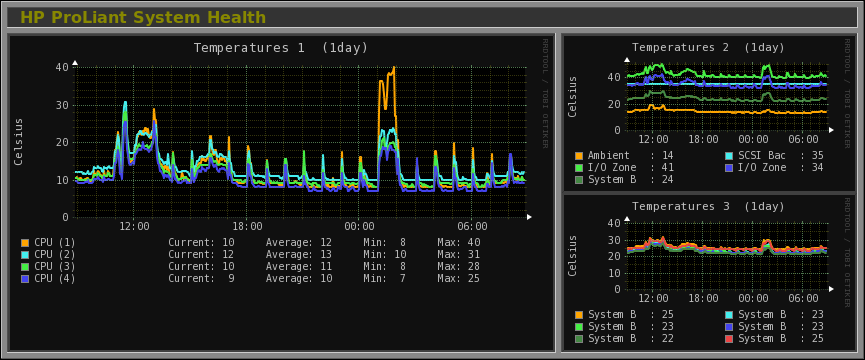
HP ProLiant System Health. |
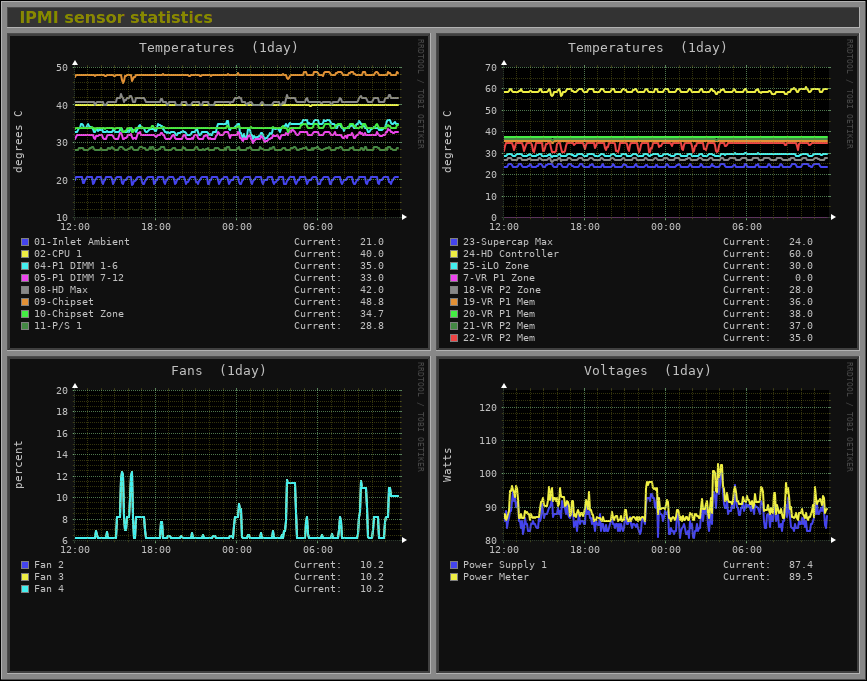
IPMI sensors. |
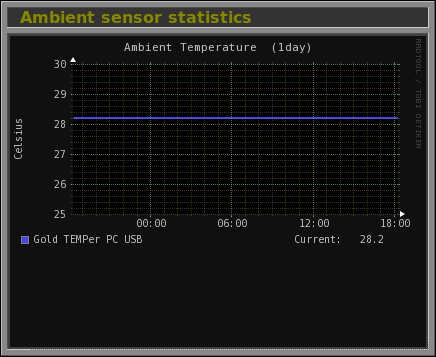
Ambient Sensors. |
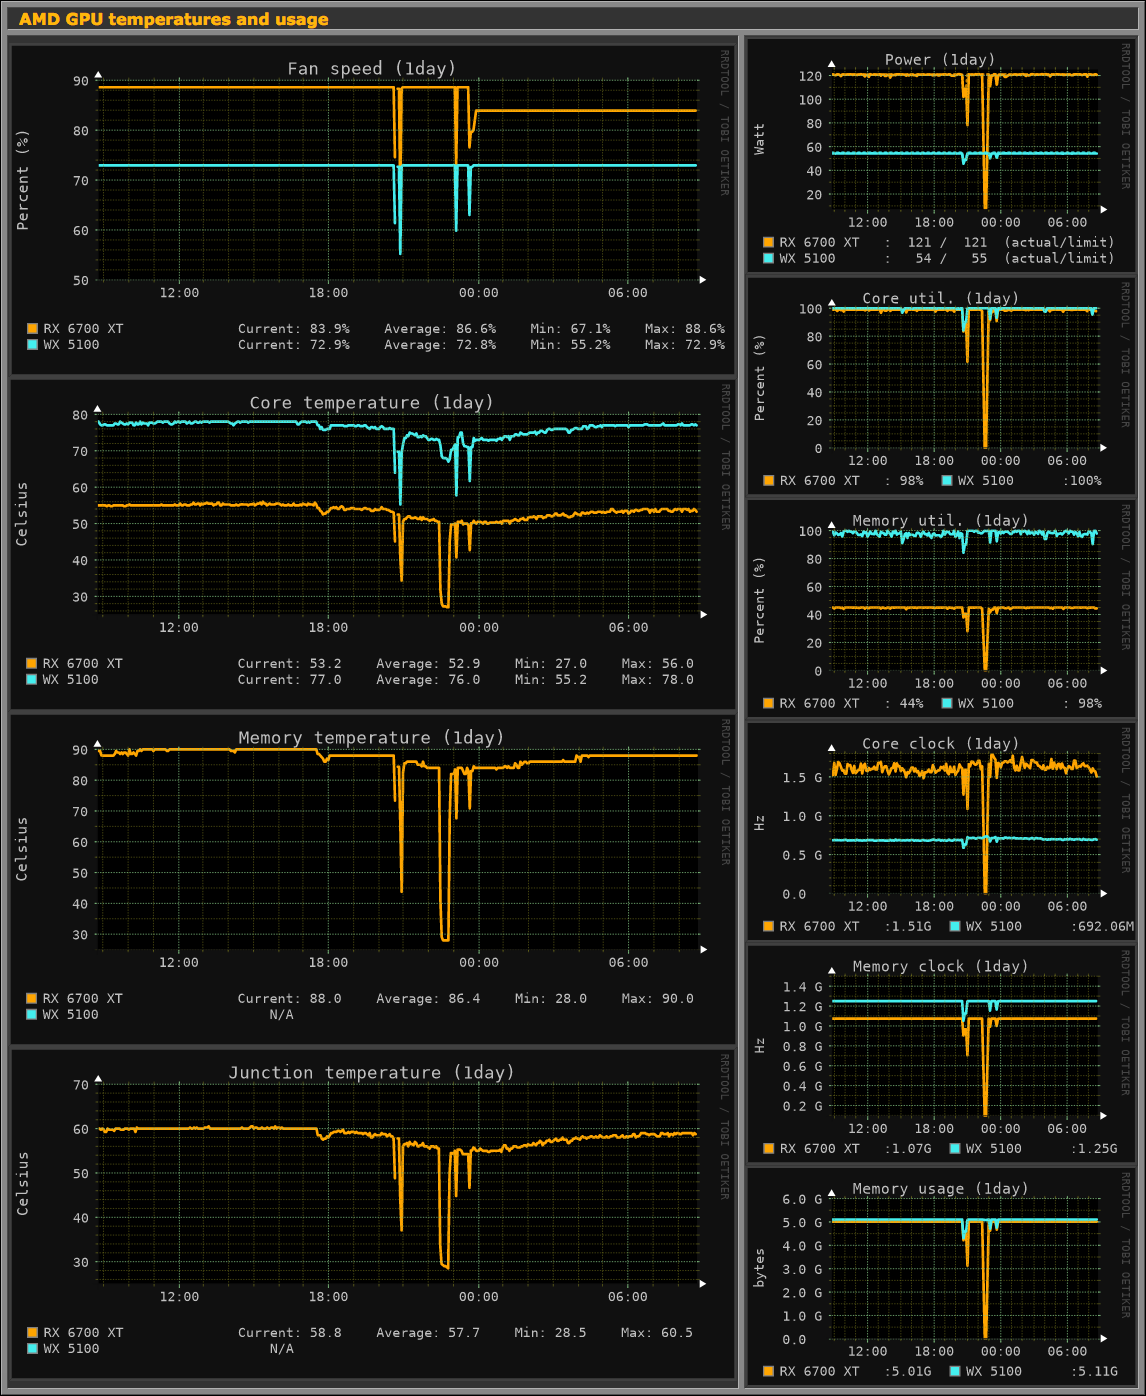
AMD GPU graphic card statistics |
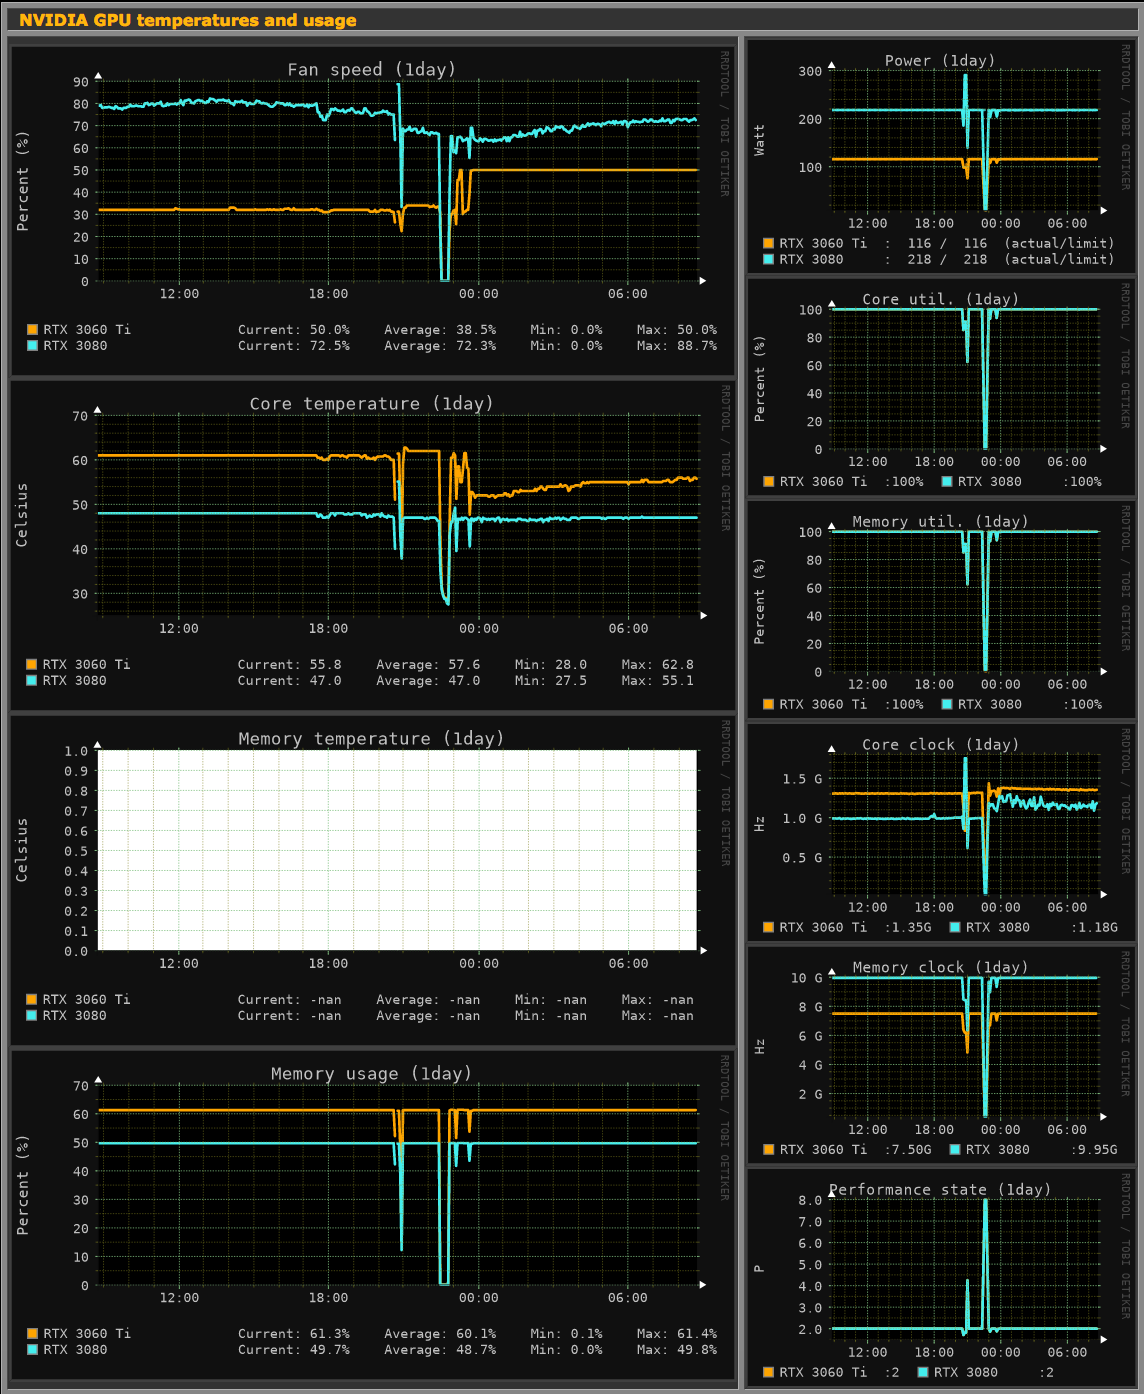
NVIDIA GPU graphic card extended statistics. |
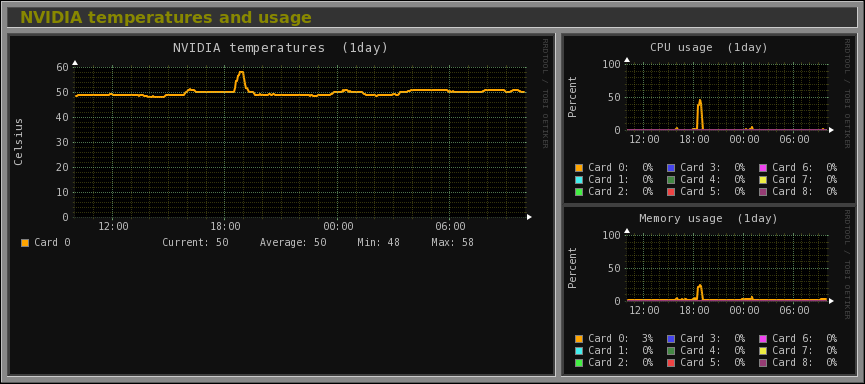
NVIDIA temperatures and usage. 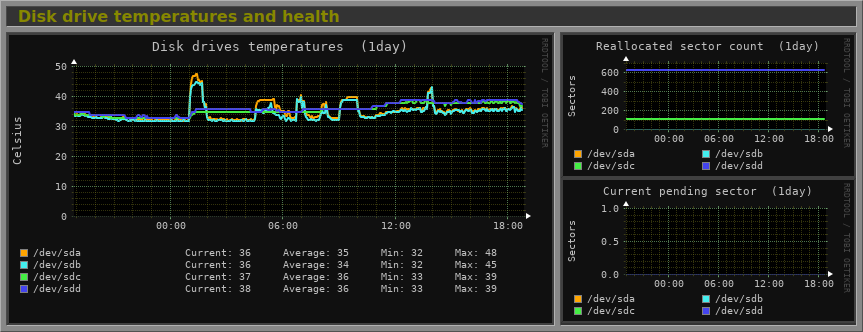
Disk drive temperatures and health. |
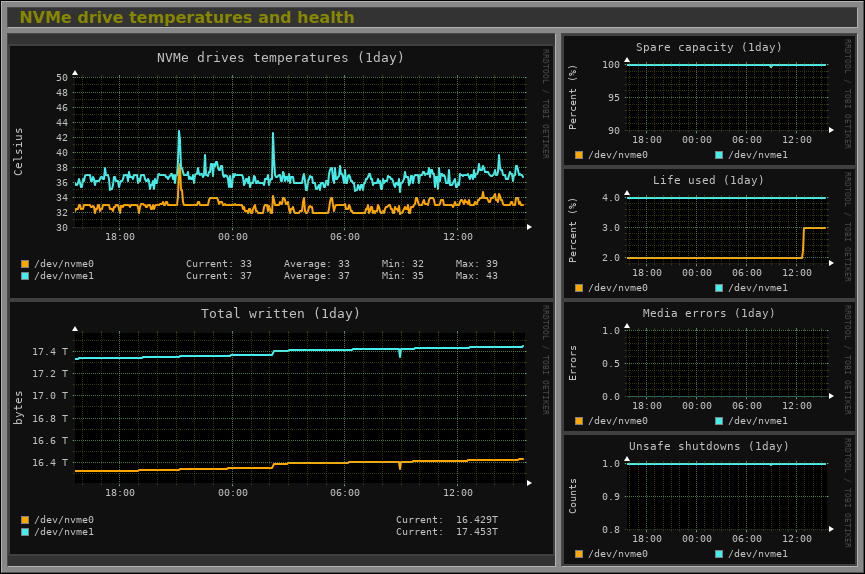
NVMe drive temperatures and health. |
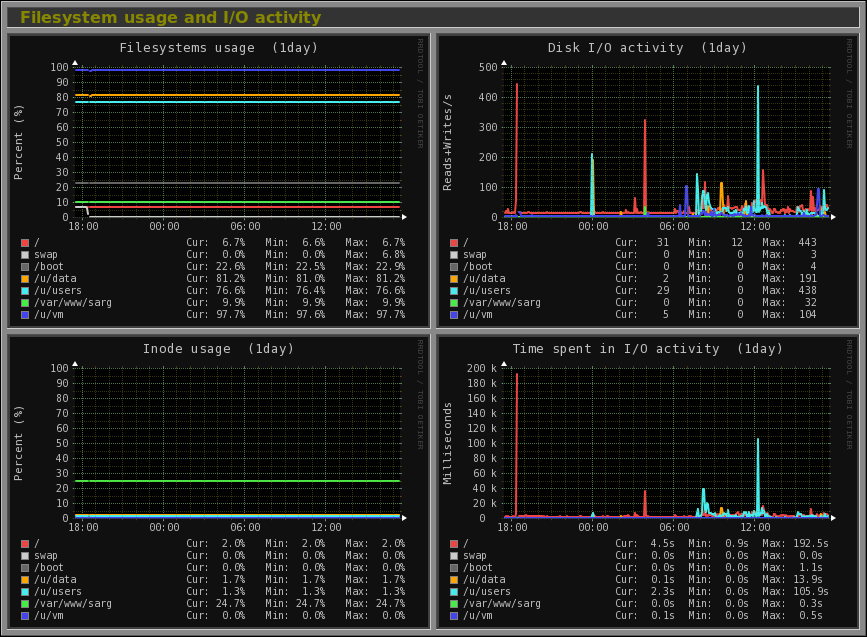
Filesystem usage and I/O activity. |
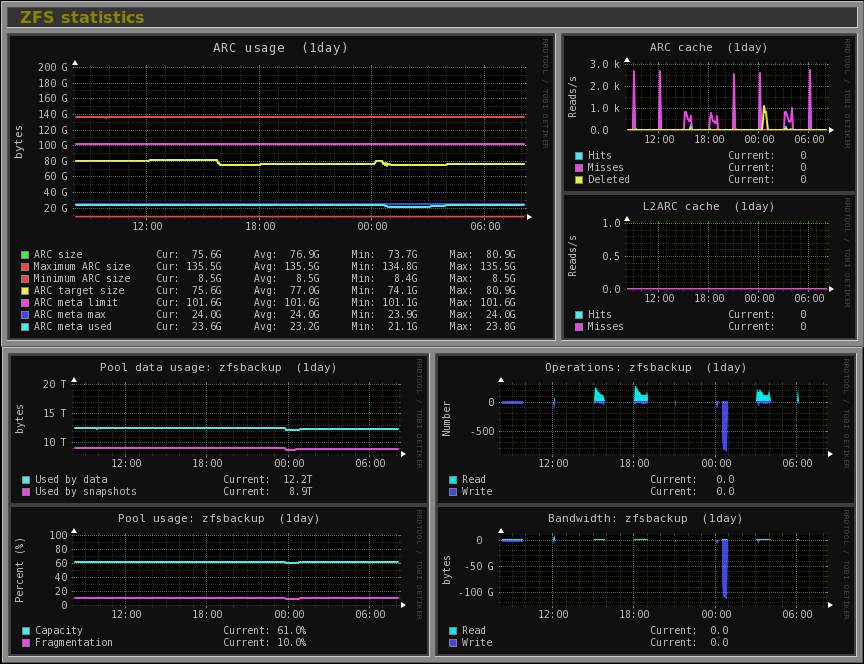
ZFS statistics with 1 pool named zfsbackup. |
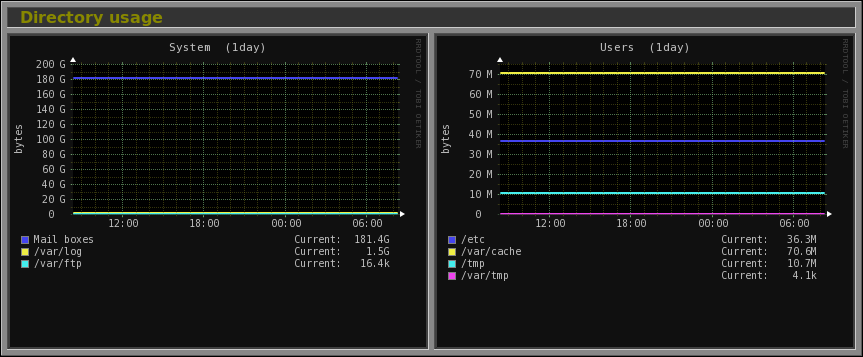
Directory usage. 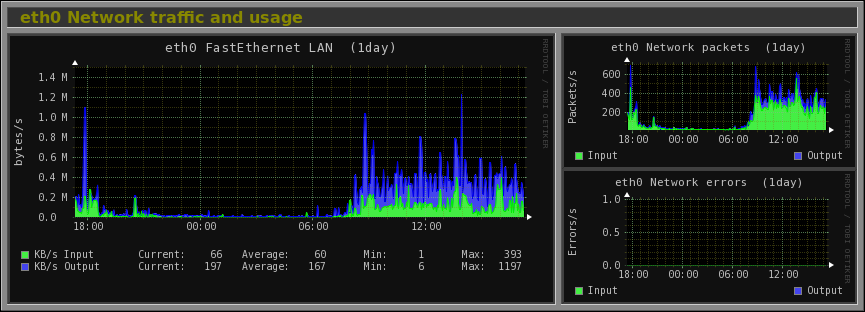
Ethernet interface with traffic, packets and errors activity. |
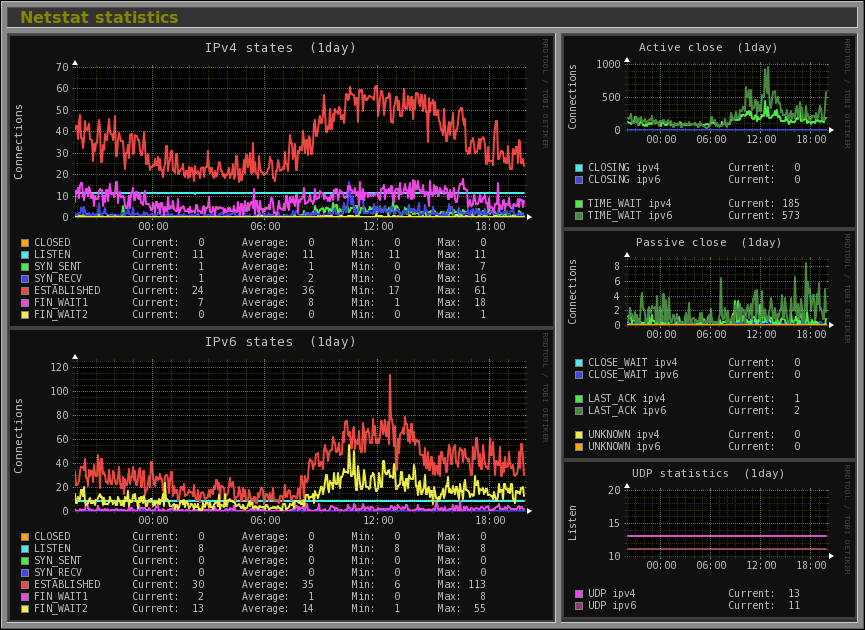
Netstat statistics. |

Tinyproxy statistics. |
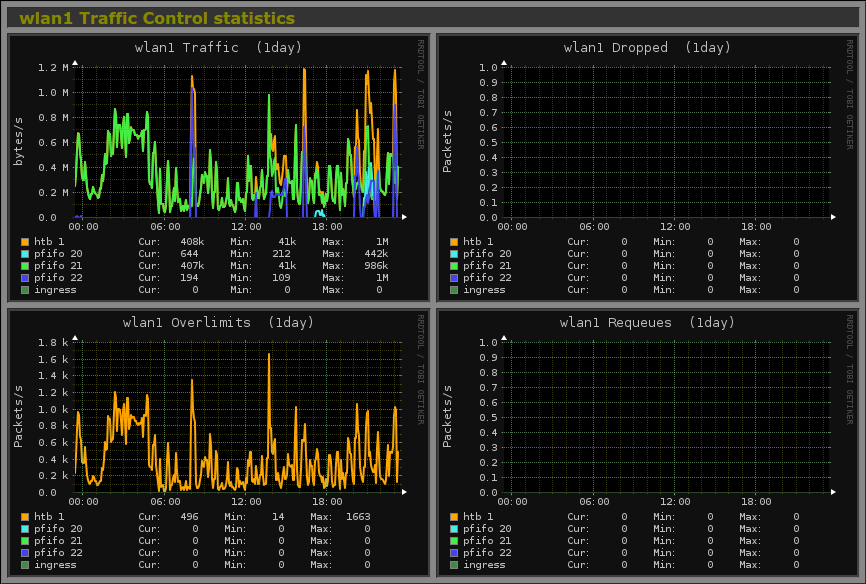
Traffic Control statistics. |
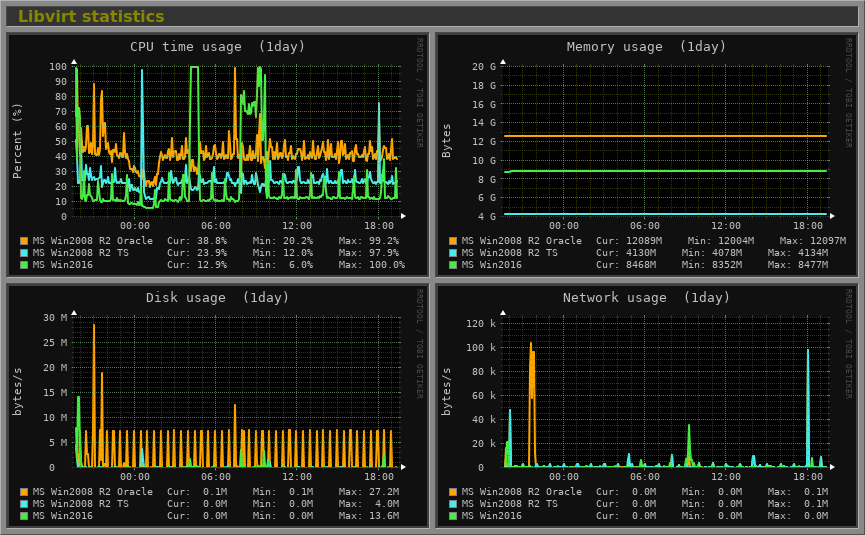
Libvirt statistics of 3 virtual machines. |
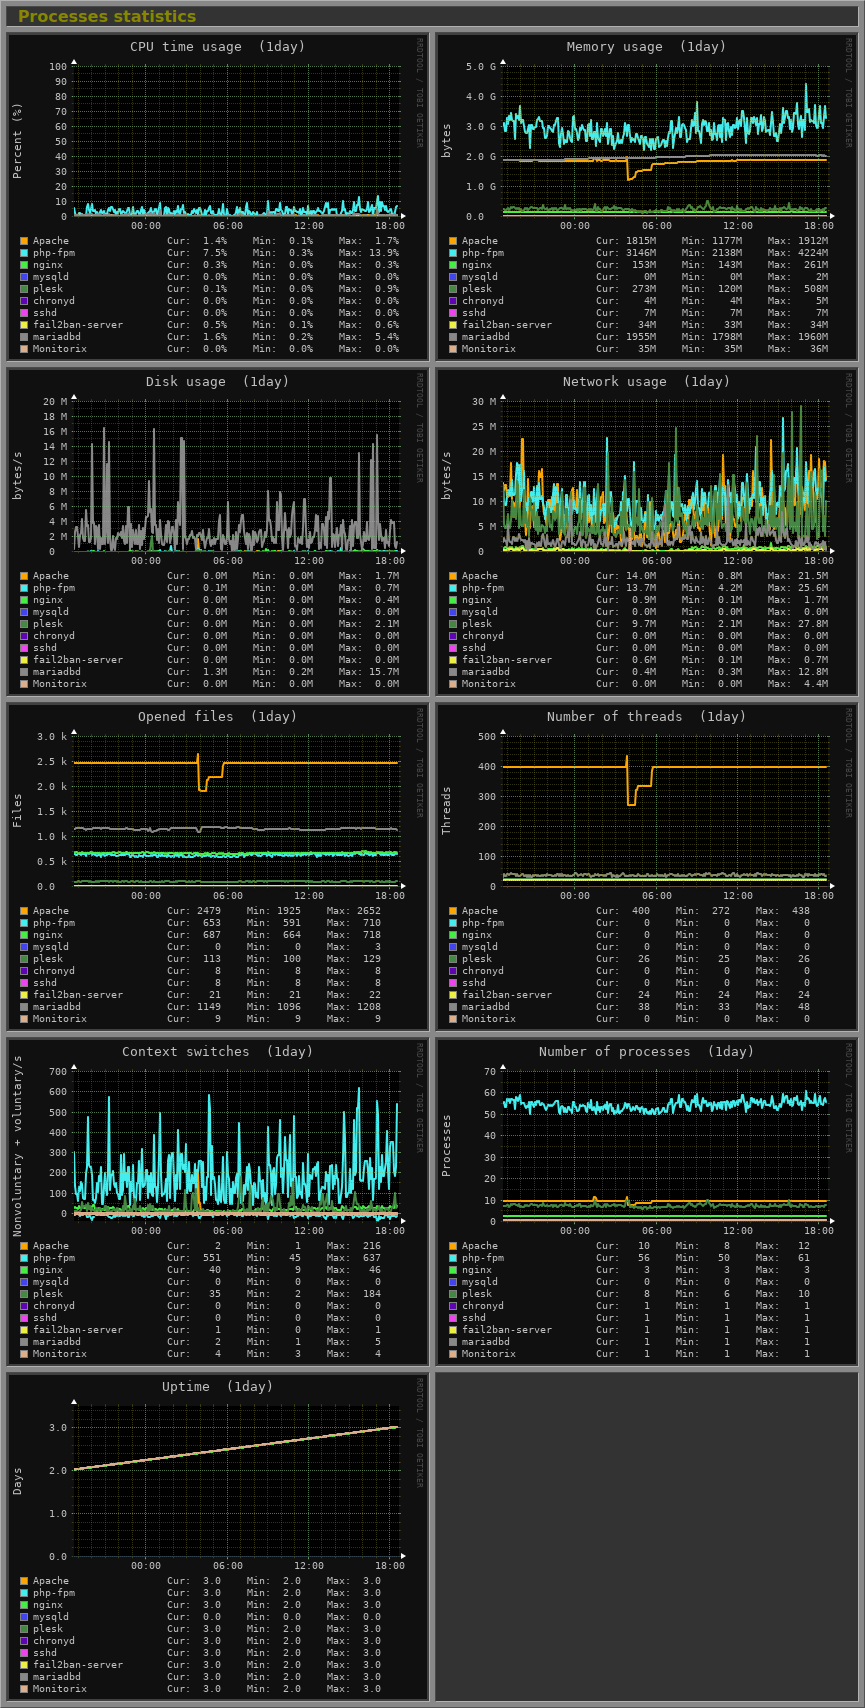
Process statistics. |

System services demand (in incremental mode). 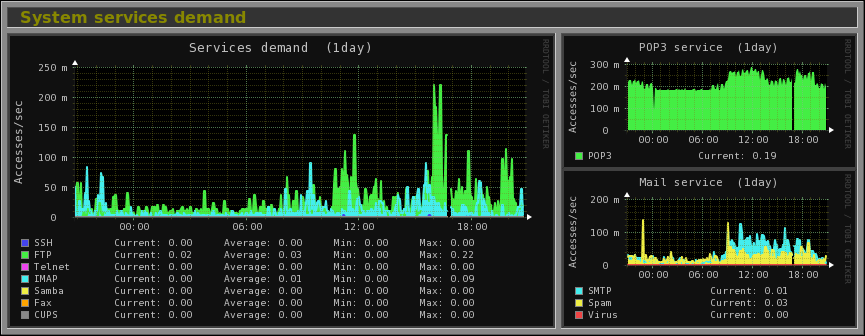
System services demand (in load mode).
|
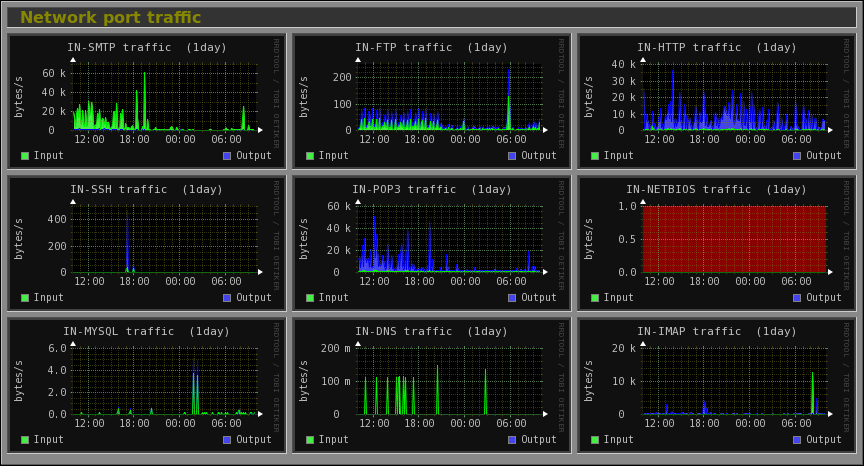
Network port activity. |
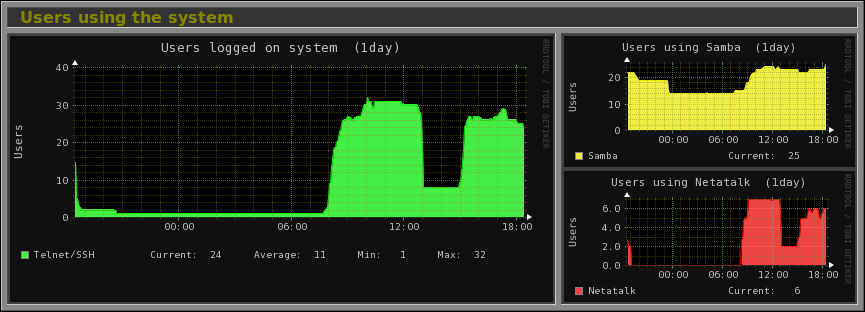
Users using the system. |
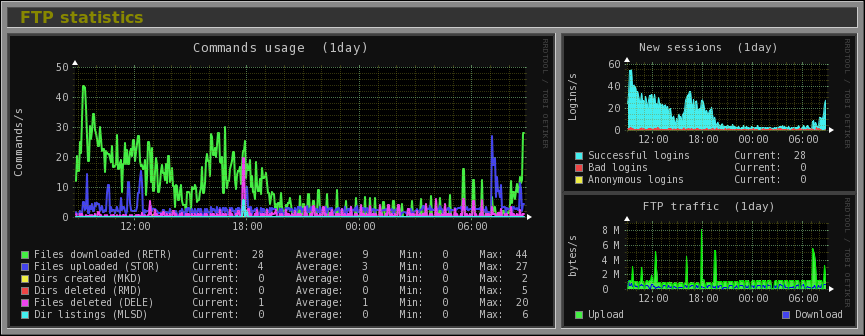
FTP statistics. |
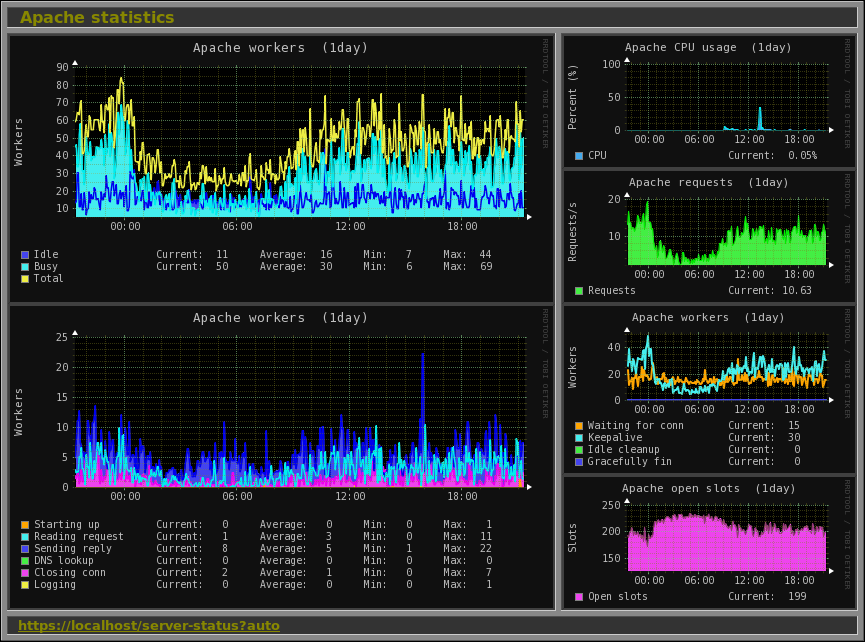
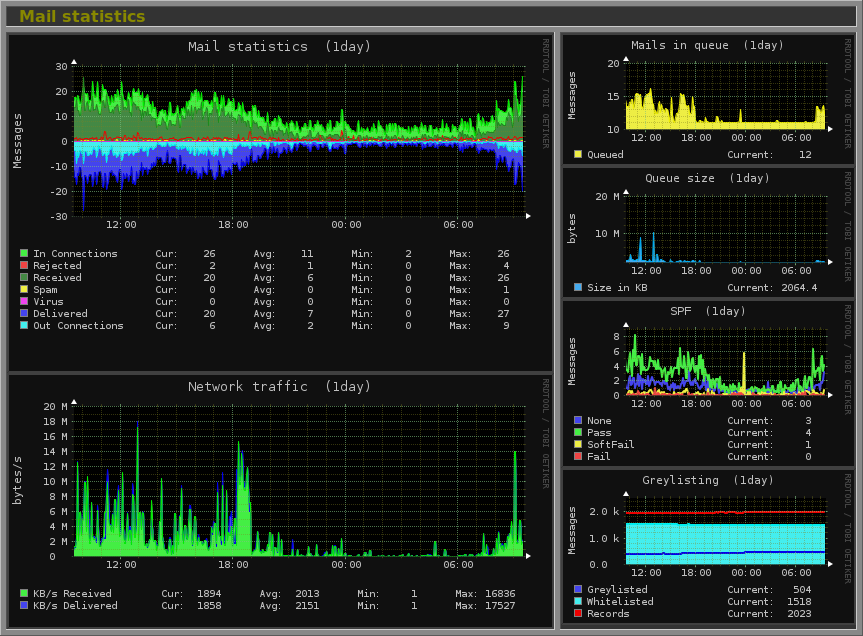
Apache statistics. |
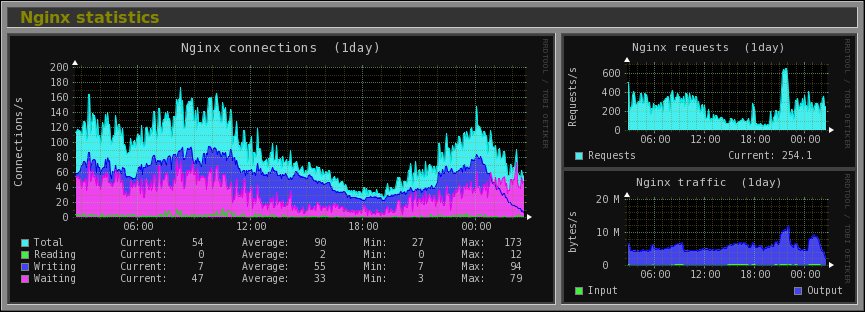
Nginx statistics. 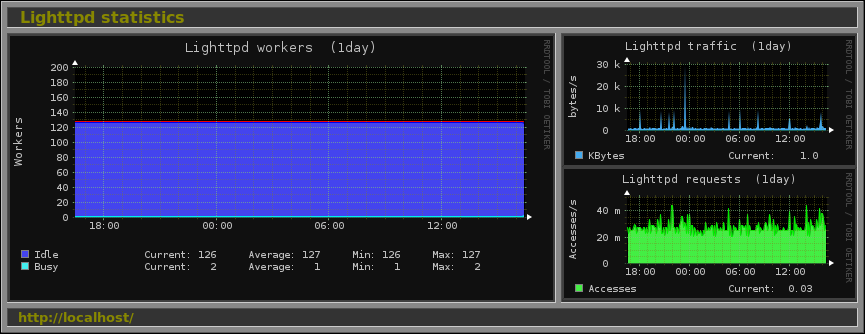
Lighttpd statistics. |
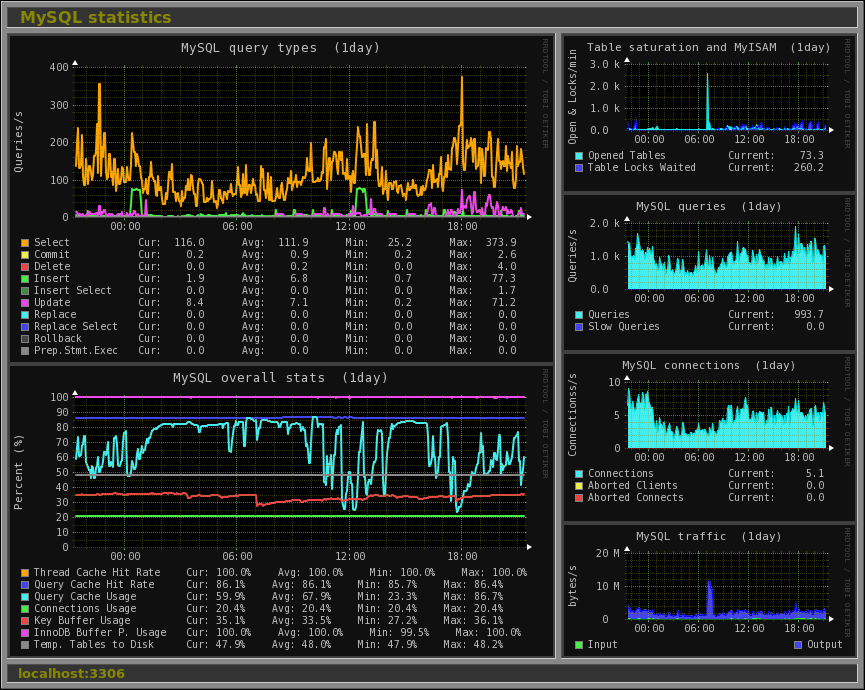
MySQL statistics. |
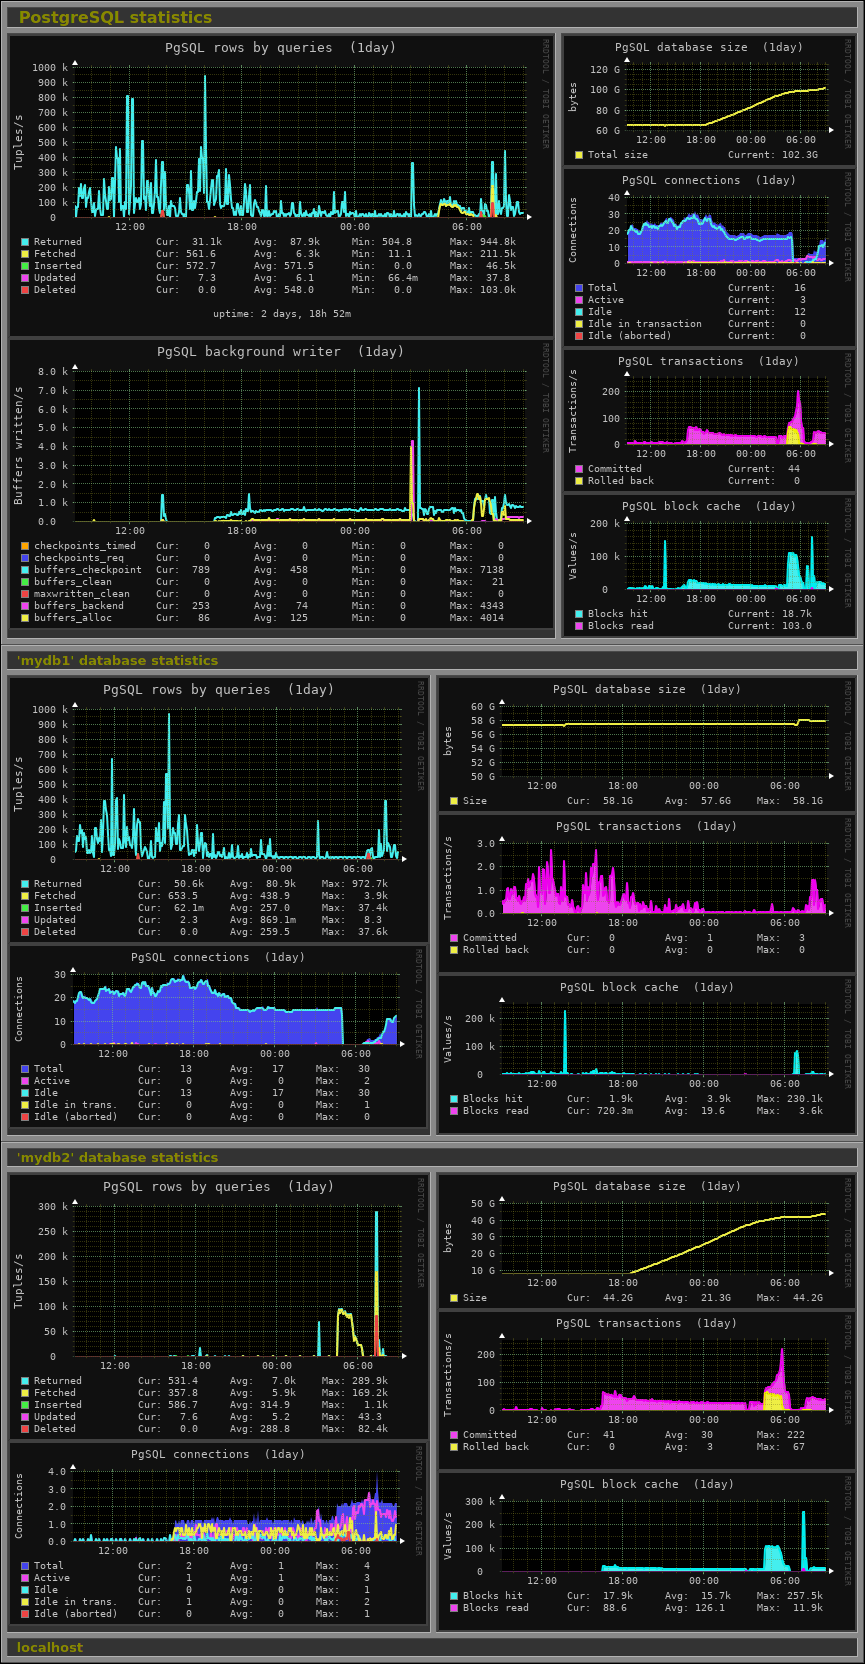
PostgreSQL statistics monitoring 2 databases. |
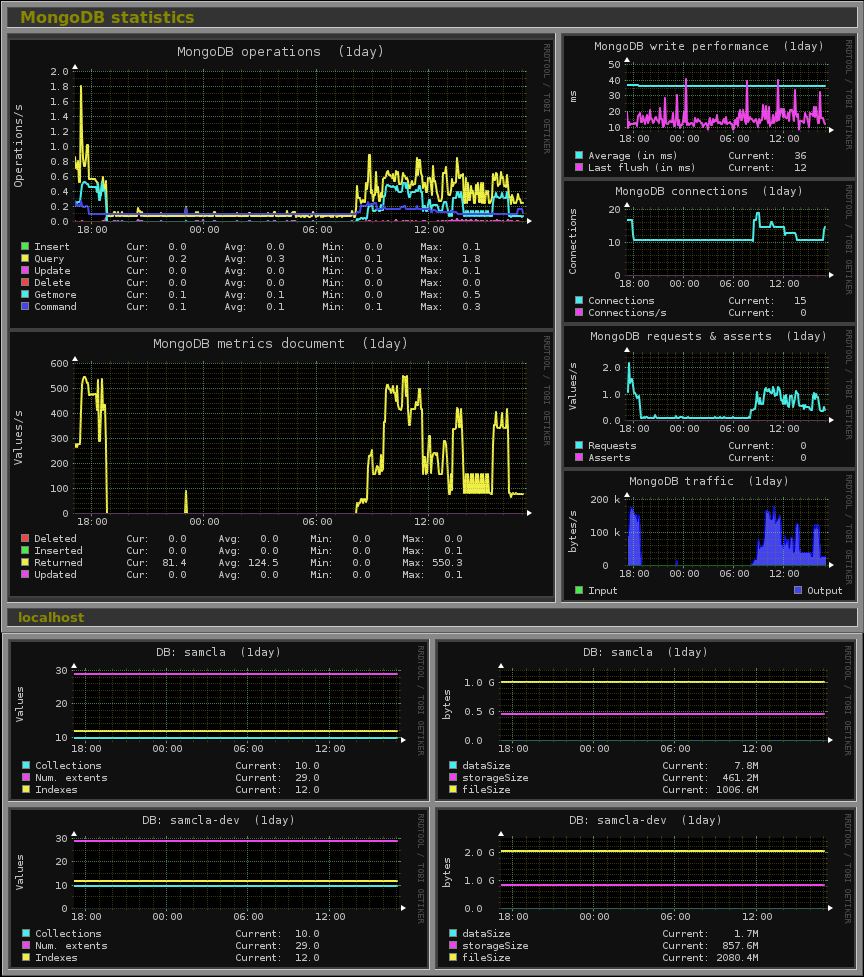
MongoDB statistics.
|
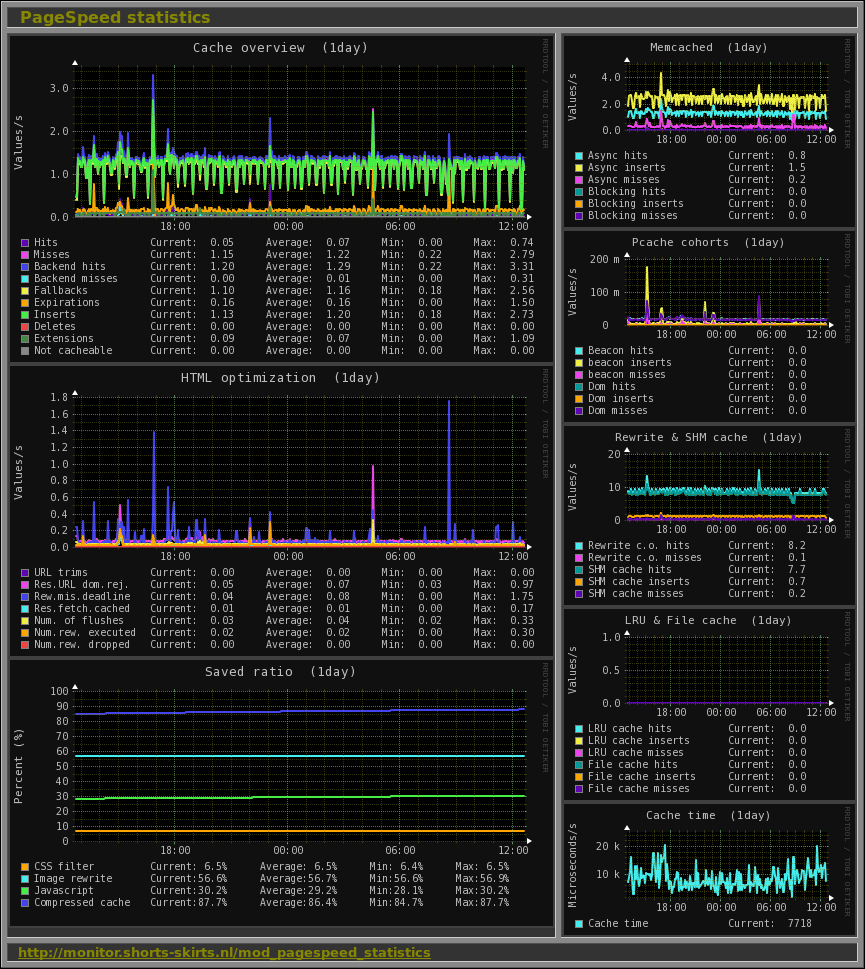
PageSpeed Module statistics. |
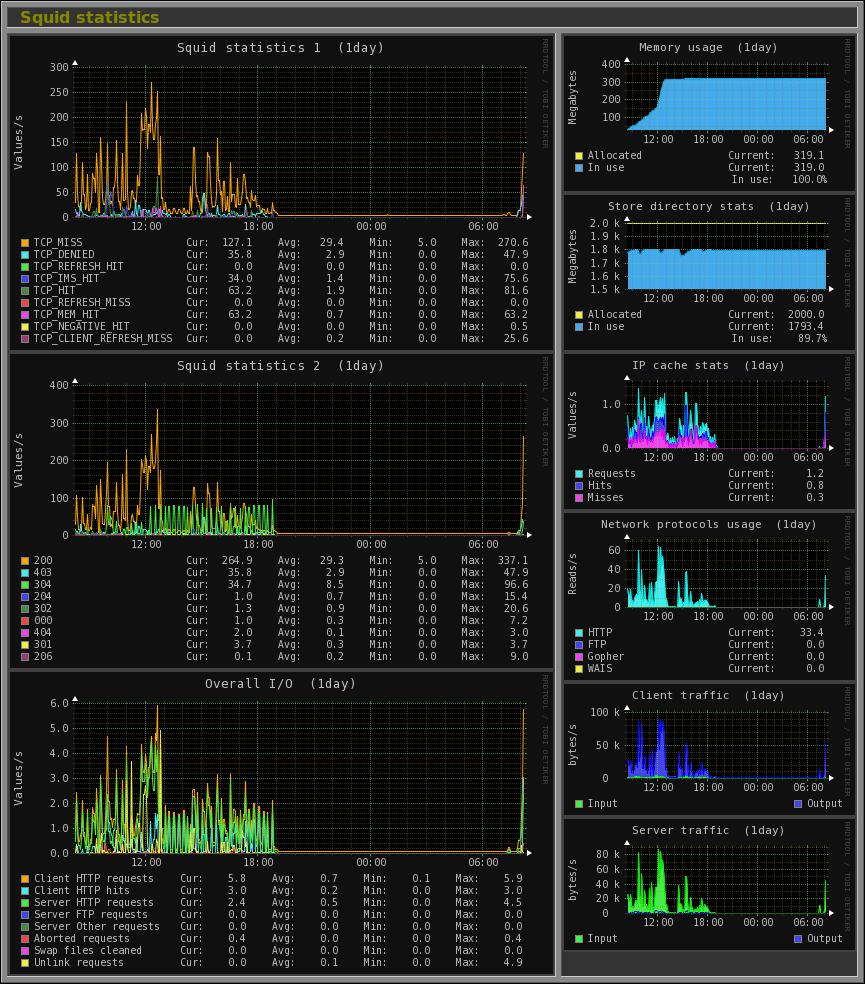
Squid Proxy Web Cache statistics. |
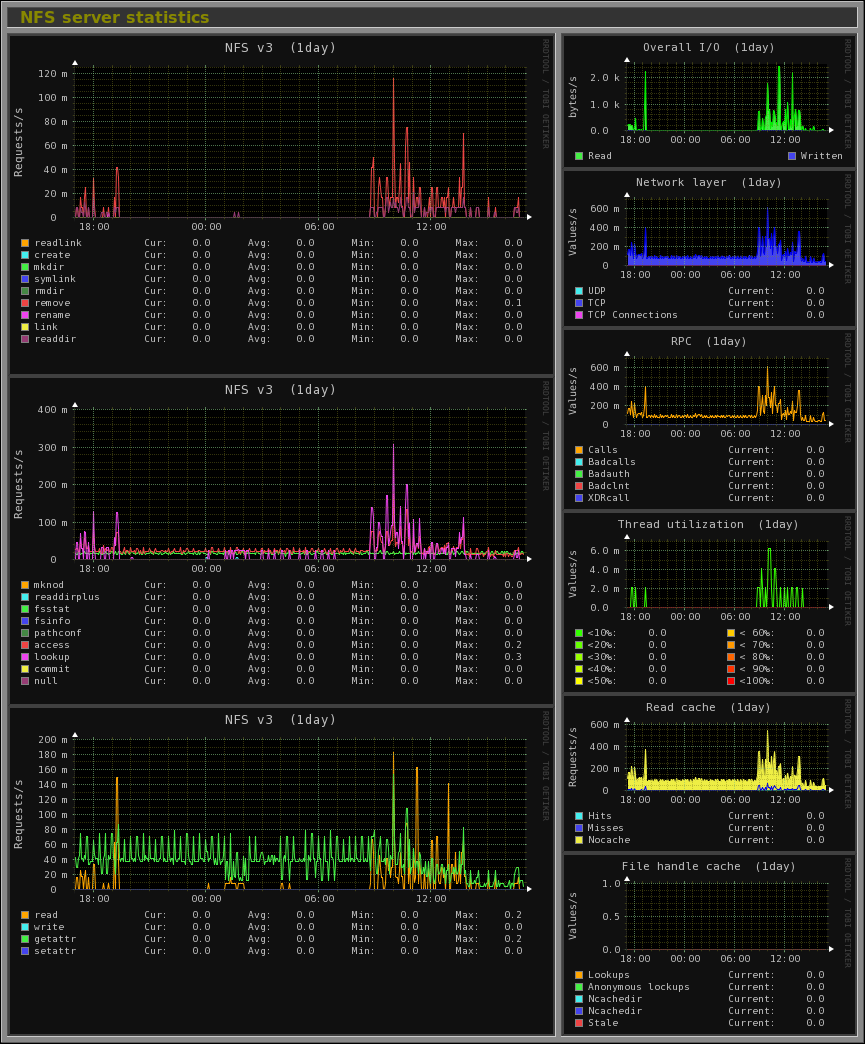
NFS server statistics. |
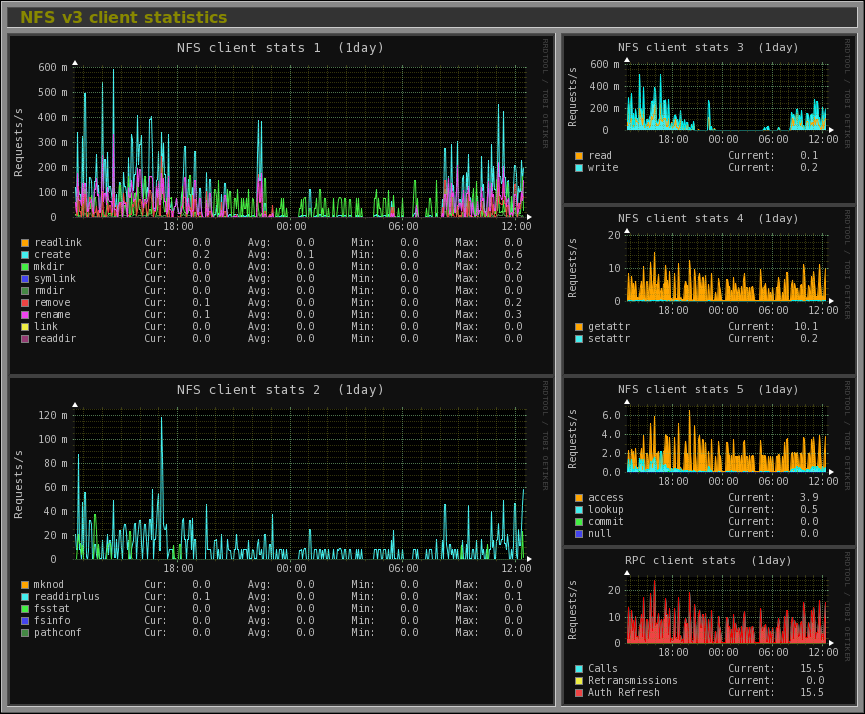
NFS client statistics. |
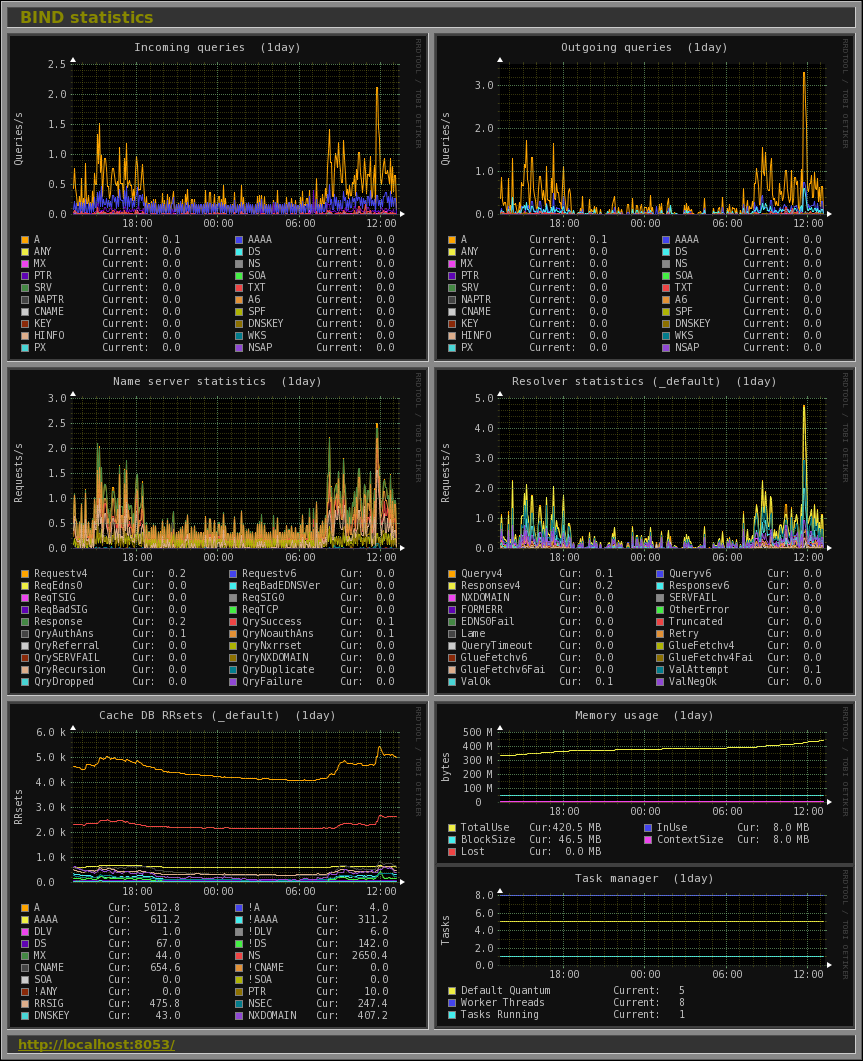
BIND statistics. |
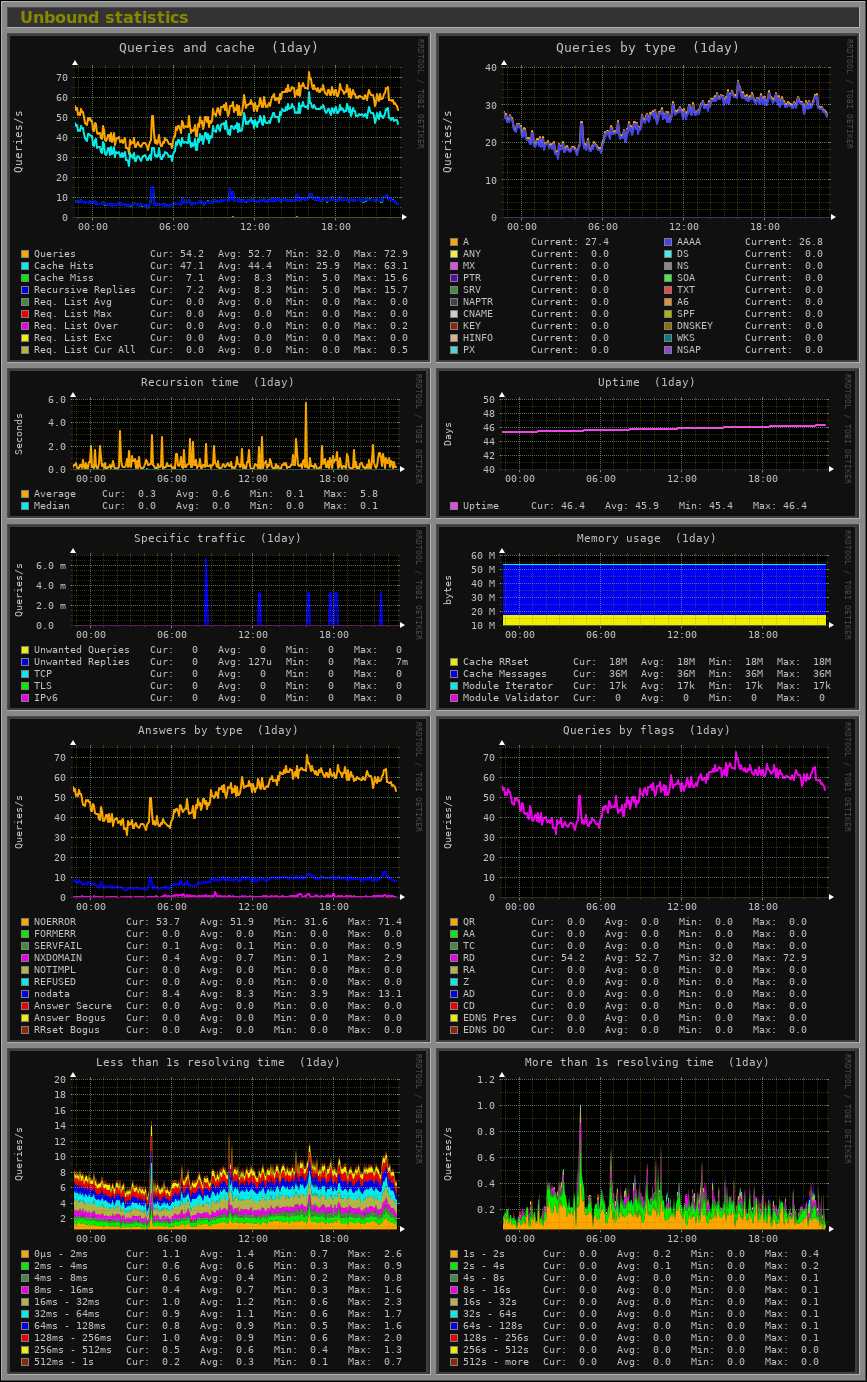
Unbound statistics. |
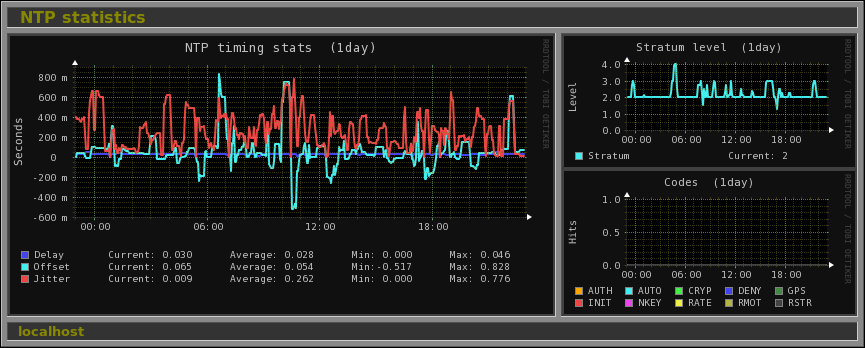
NTP statistics. |
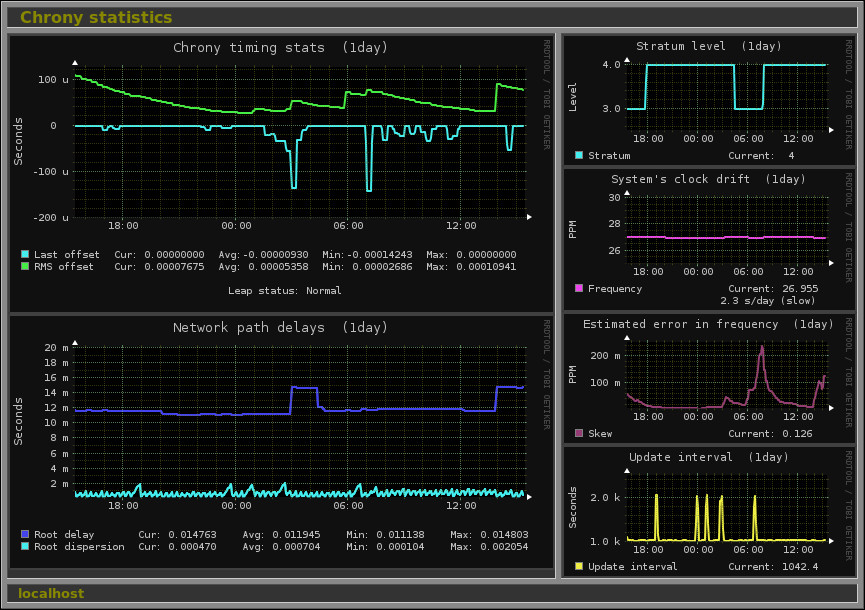
Chrony statistics. |
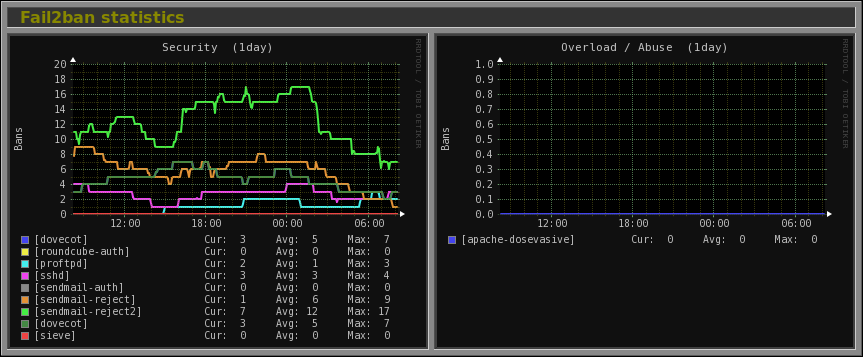
Fail2ban statistics. |
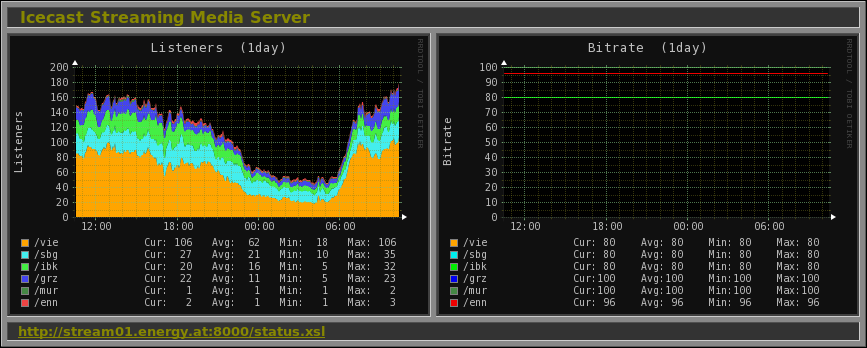
Icecast Streaming Media Server. |
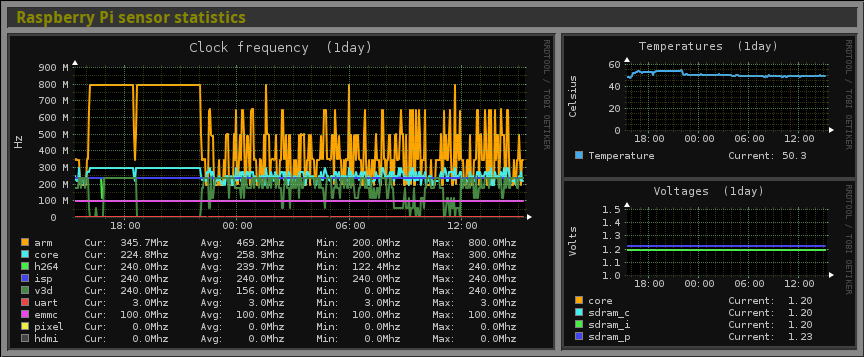
Raspberry Pi sensor statistics. |
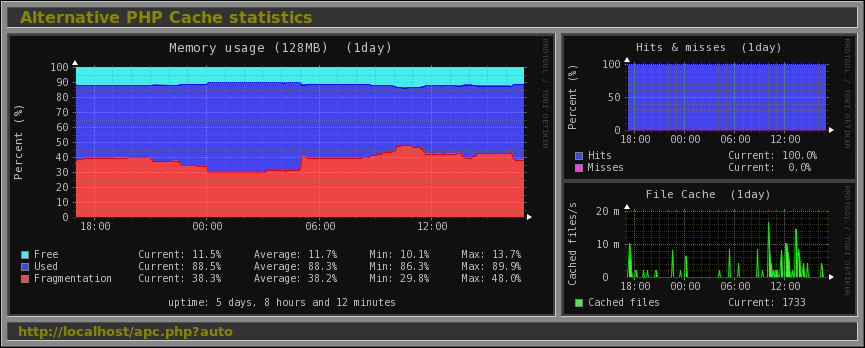
Alternative PHP Cache statistics. |
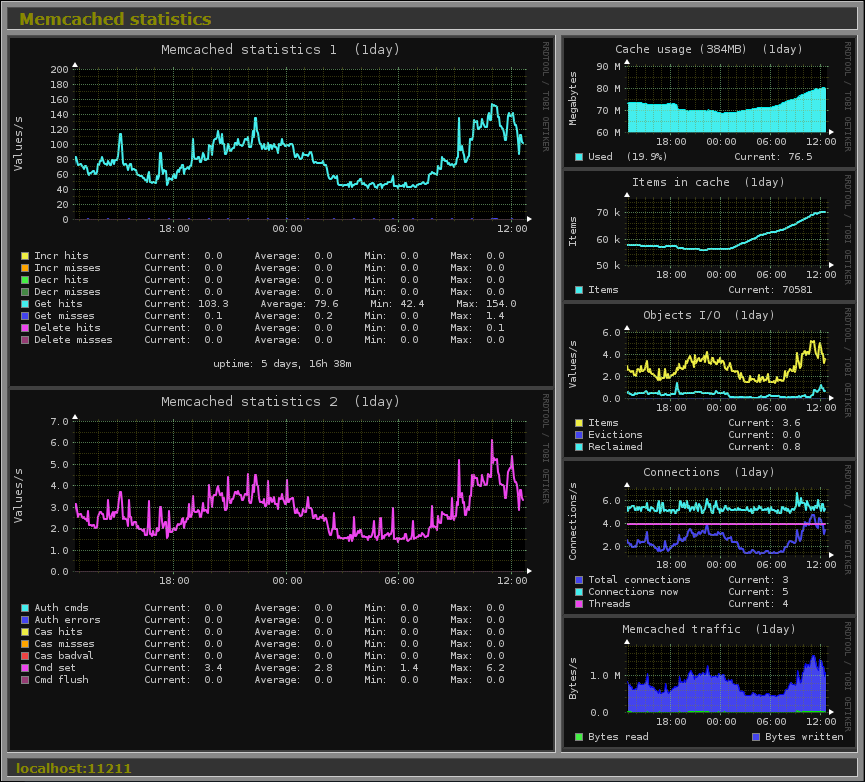
Memcached statistics. |
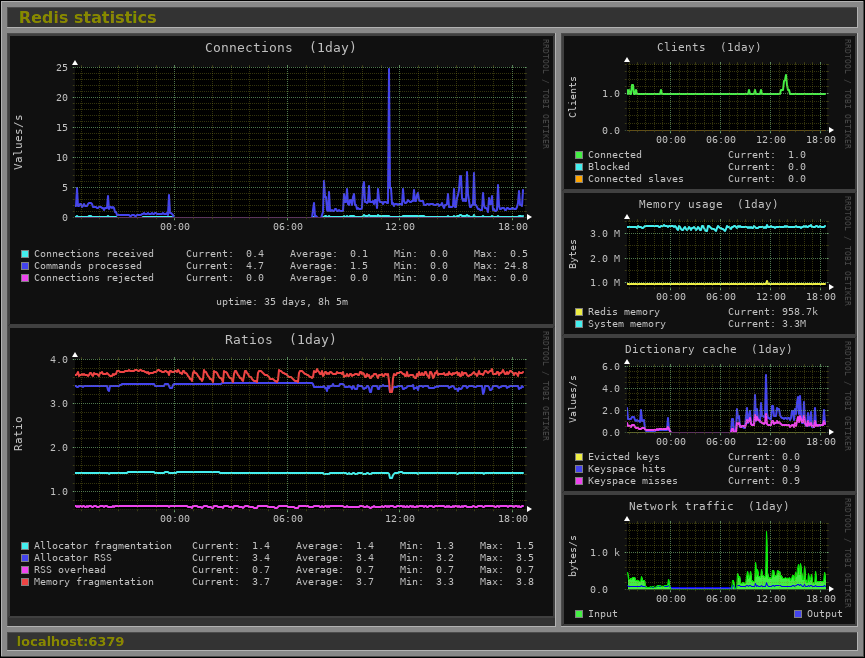
Redis statistics. |
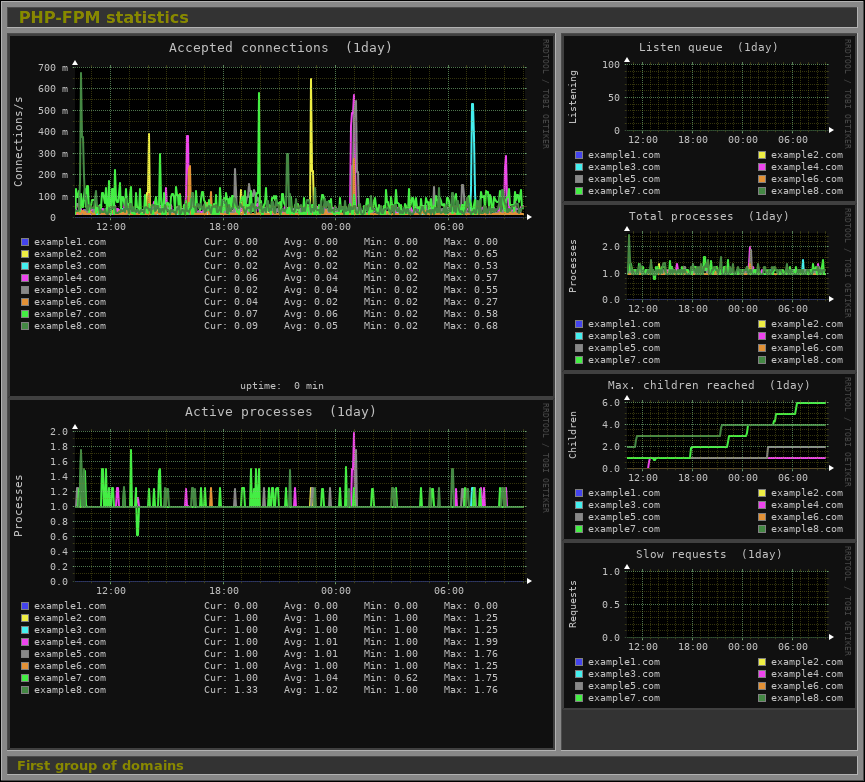
PHP-FPM statistics. |
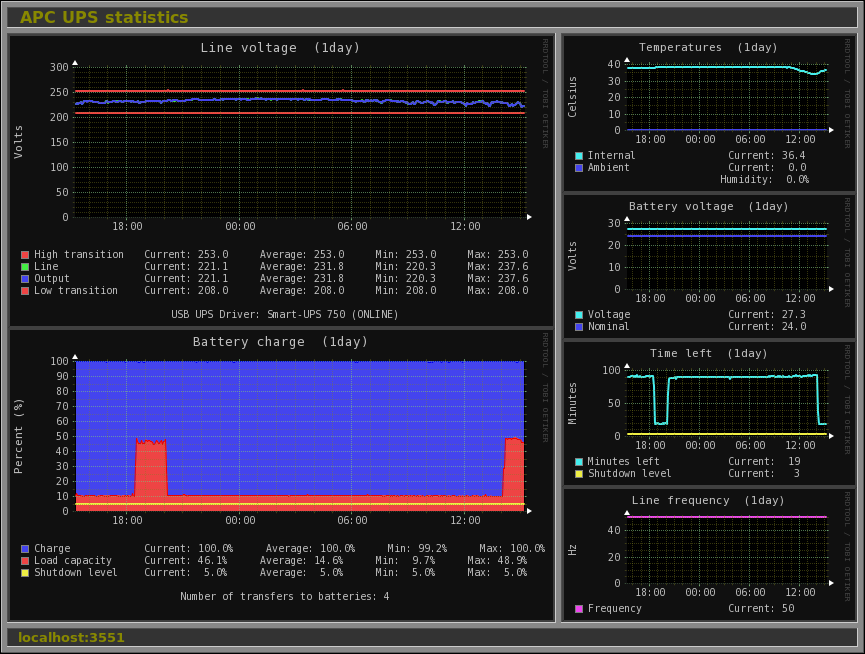
APC UPS statistics. |
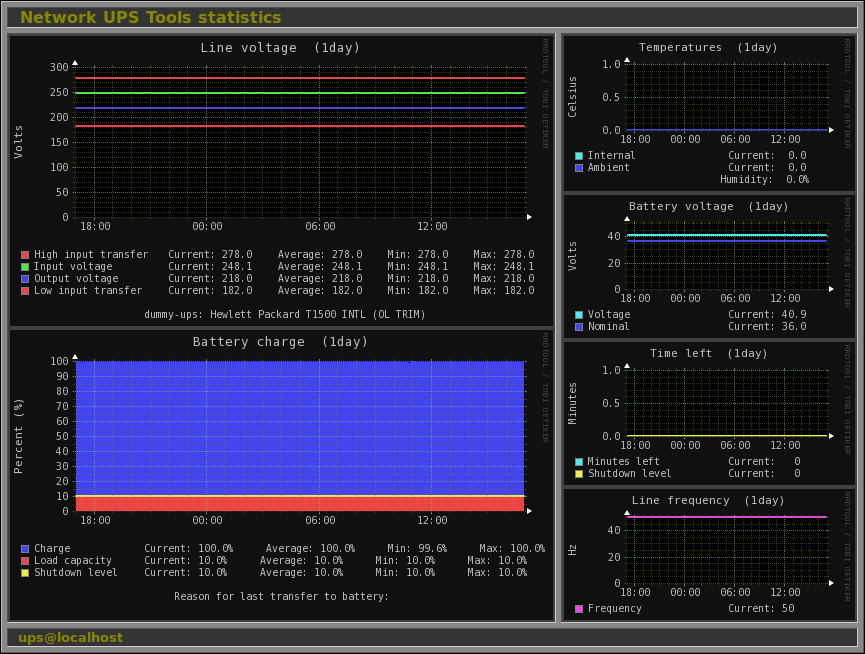
Network UPS Tools statistics. |
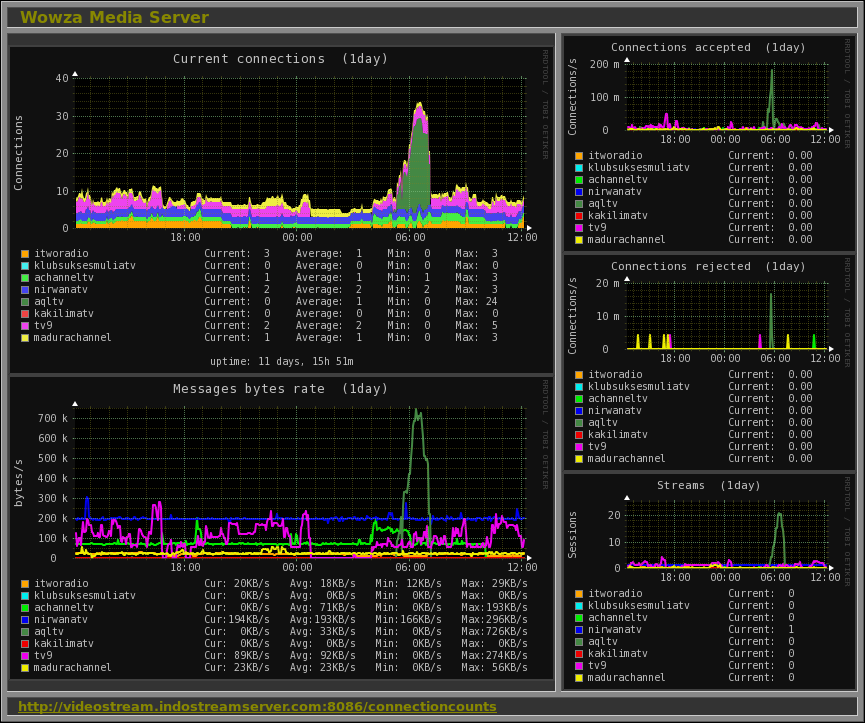
Wowza Media Server statistics. |

Devices' interrupt activity. |
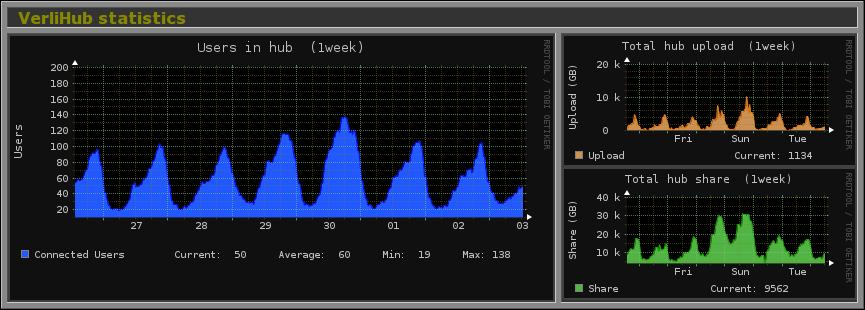
Verlihub statistics. |
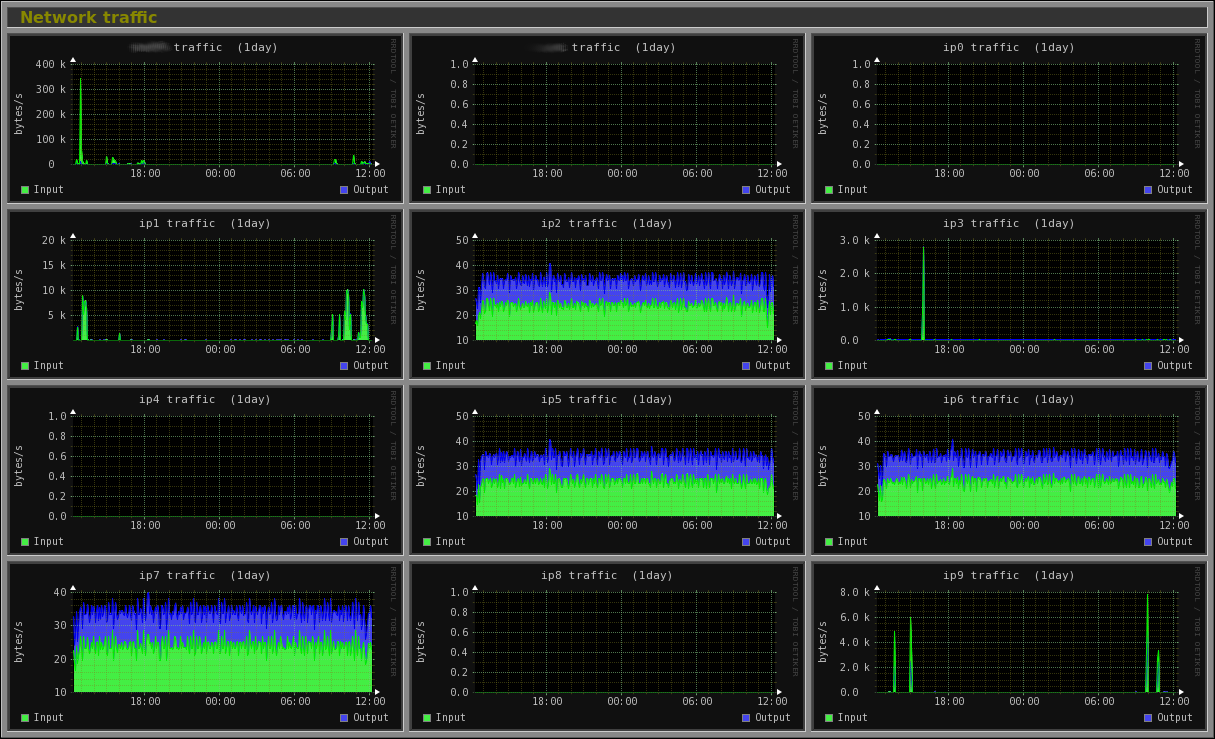
Monitorix installed on a network gateway server showing Internet activity graphs of 12 devices. |
|
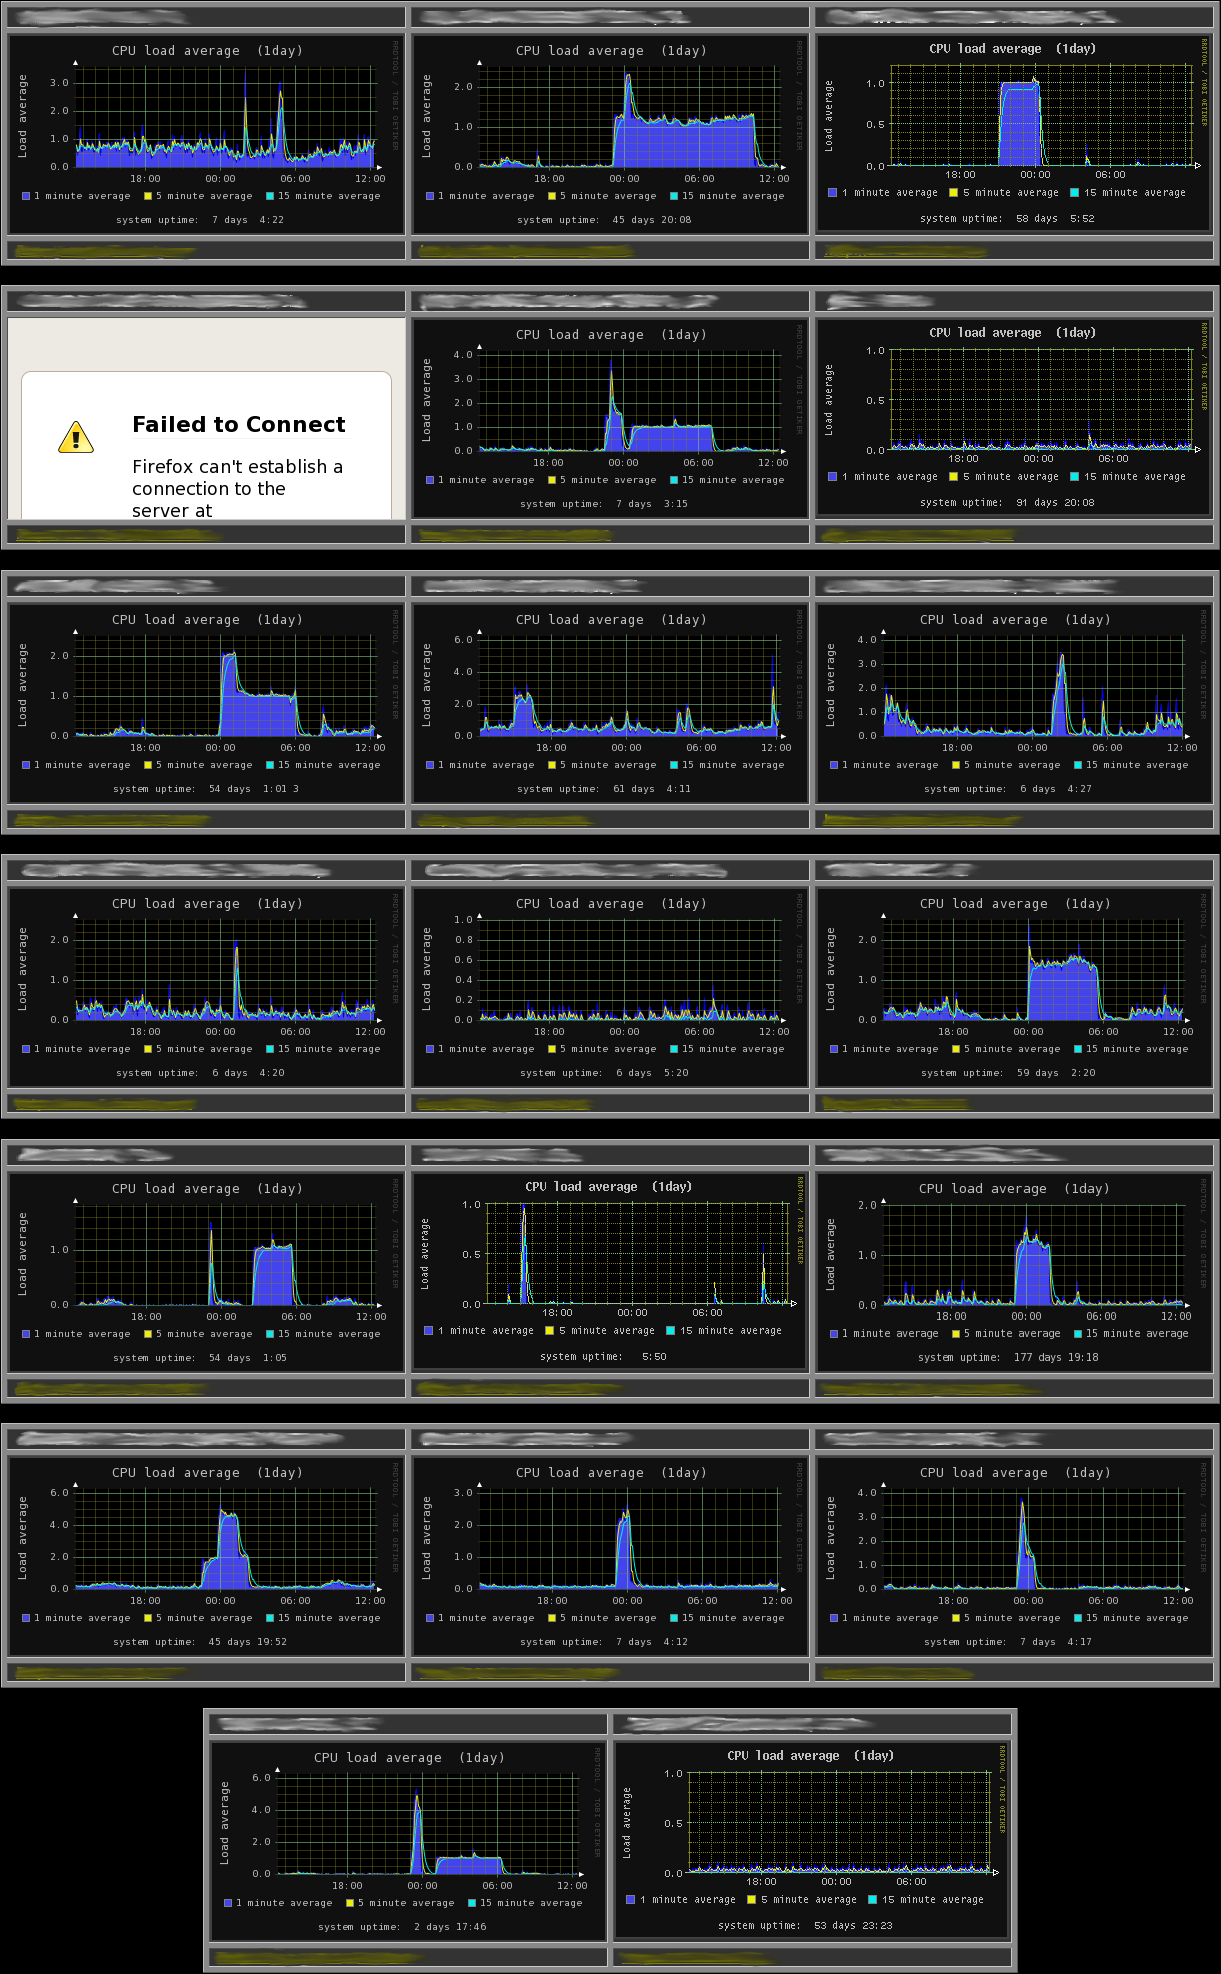
System load average of 20 remote GNU/Linux servers using Multihost view (with one of them down). |
|
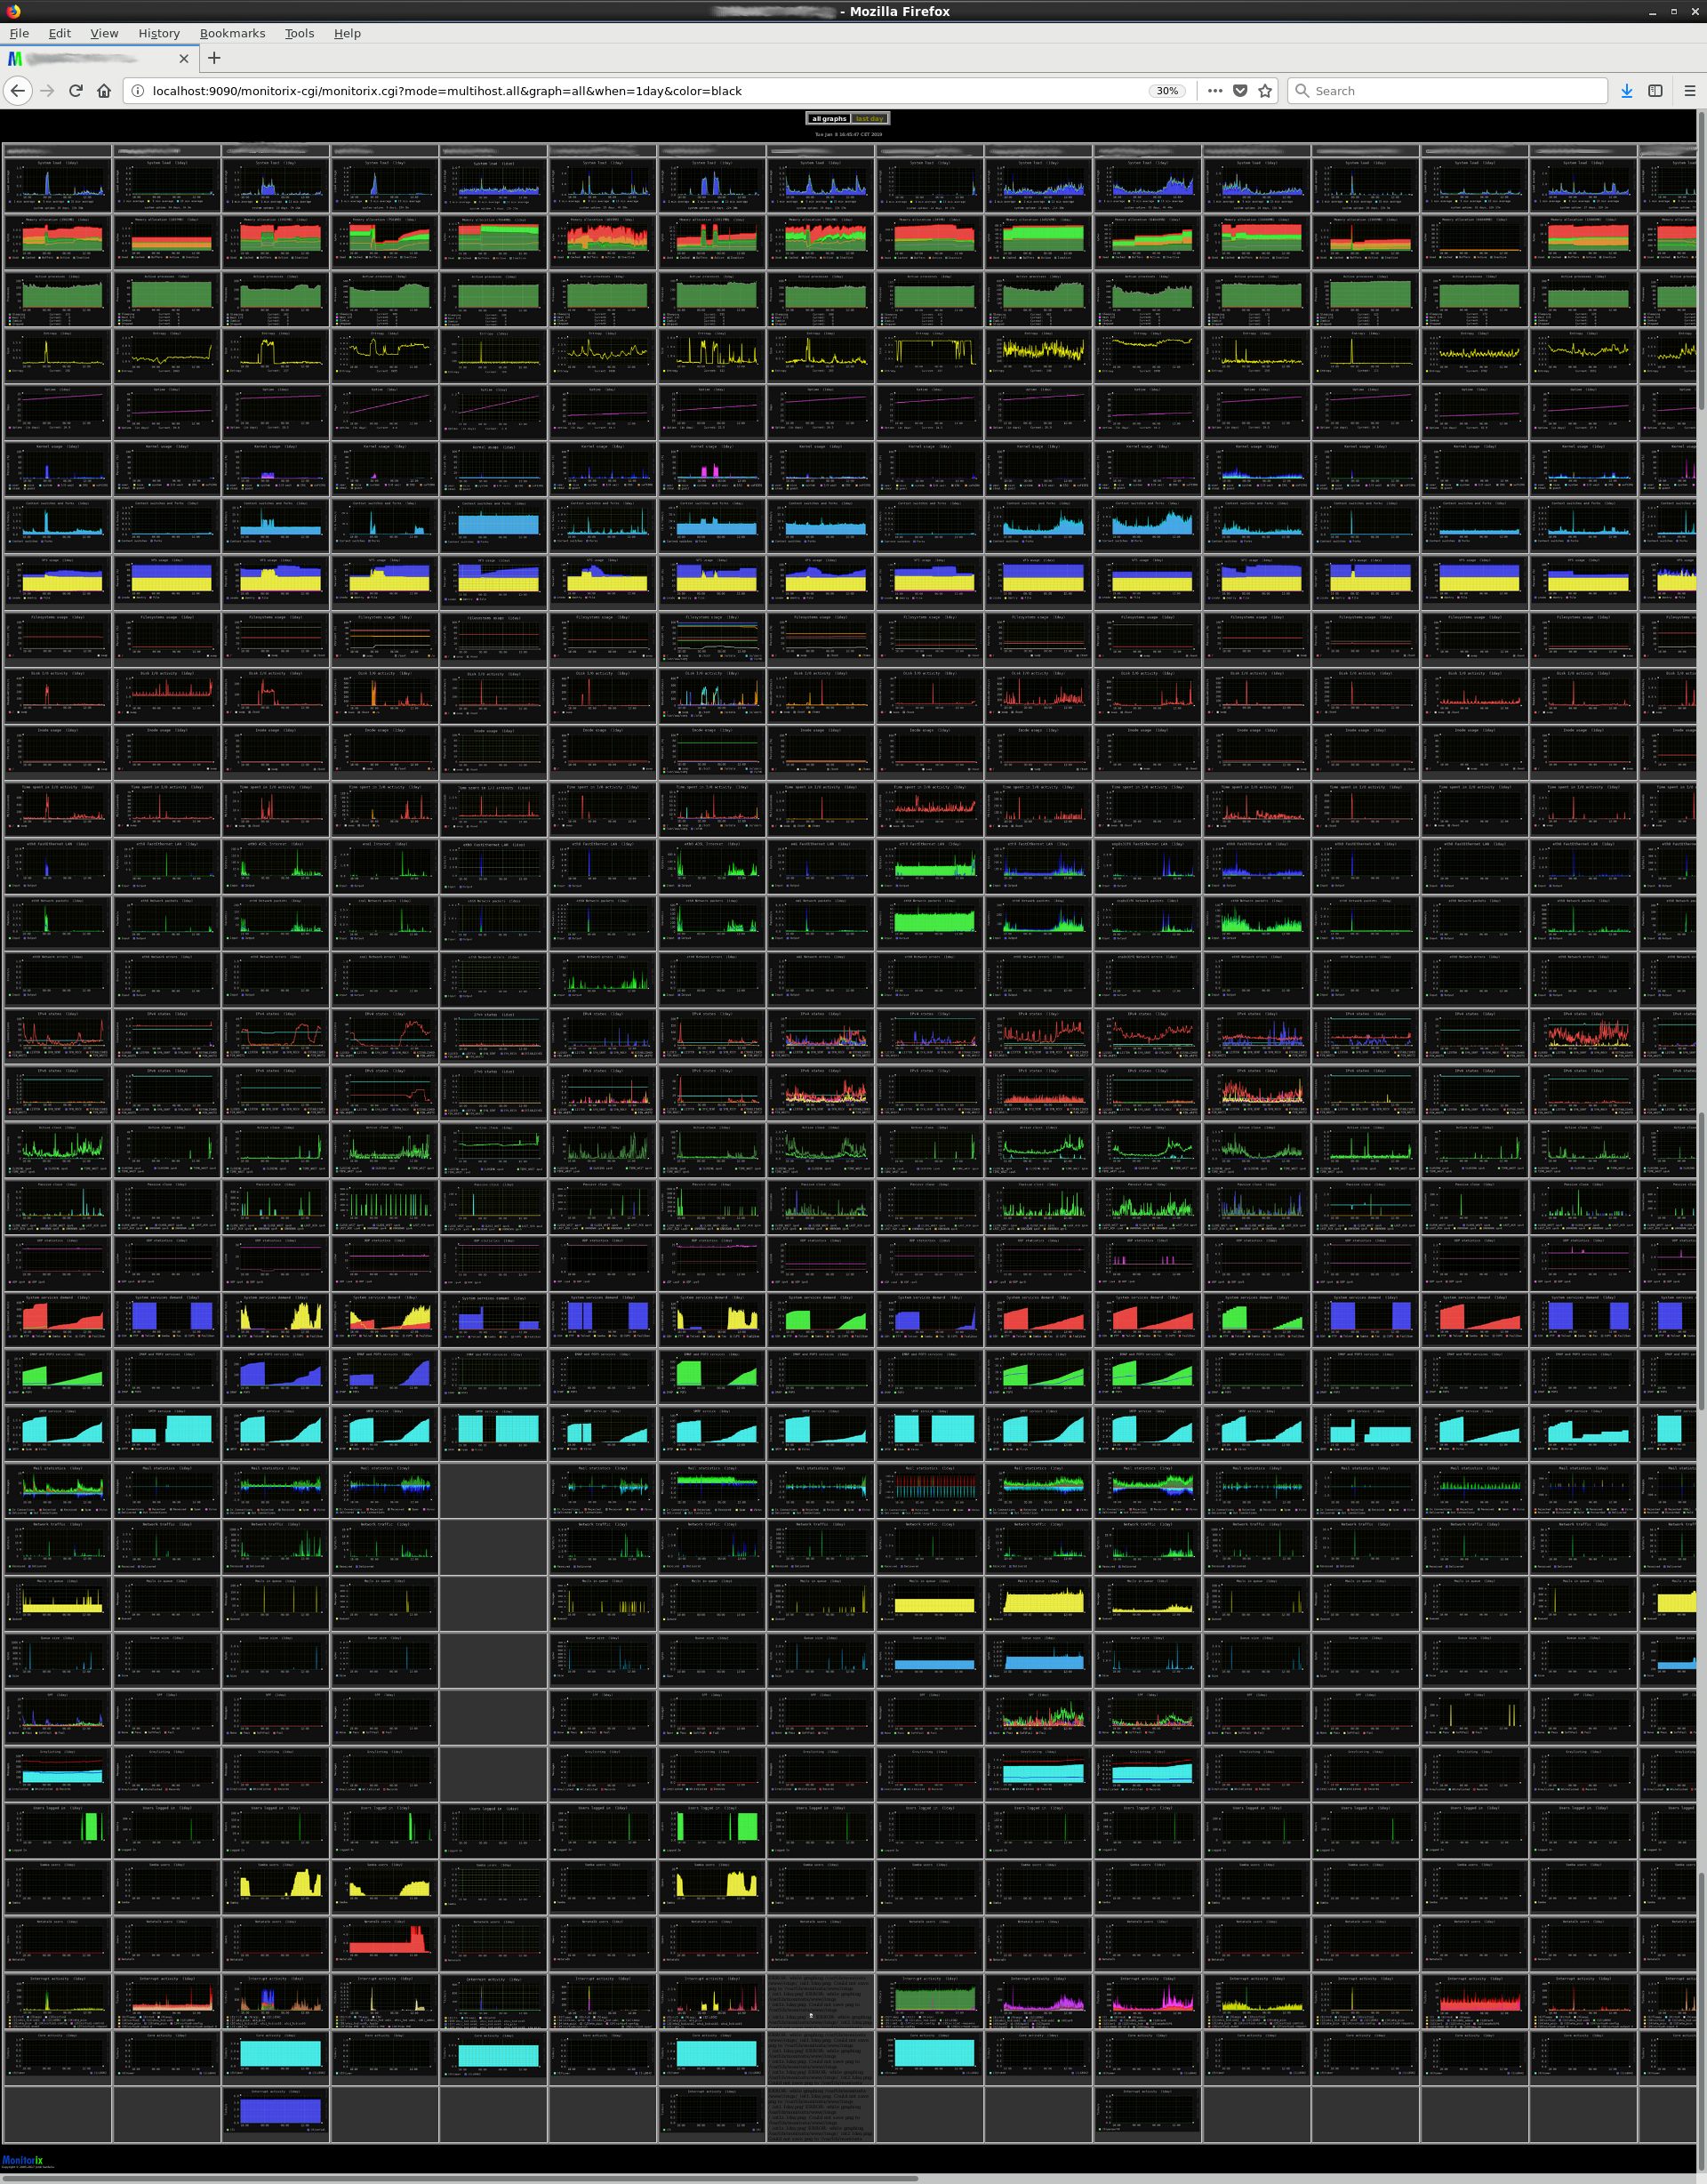
All graphs of more than 20 remote GNU/Linux servers using Multihost view. |
|