


Welcome to the Monitorix project
Take control over your small server
FAQ
Index
General
- Where can I get Monitorix?
- Can I use it for comercial purposes?
- Who is the author of Monitorix?
- Is there a mailing list for Monitorix?
- Is there an IRC channel for Monitorix?
- What are the right steps to upgrade Monitorix on a RHEL/Fedora/Rocky Linux system?
- What is the proper way to configure Monitorix?
- Can be used in non GNU/Linux systems?
- Where can I find more documentation about the options in the configuration file?
- What about the .rrd files in
/var/lib/monitorix, it's expected that they will grow every day? - I have a lot of servers, how can I use Monitorix to centralize the statistics?
- How can I monitor Internet traffic on a gateway server?
- How should I interpret the Memory Allocation graph?
- How should I interpret the Memory Allocation graph? (for versions before 3.11.0)
- Is it possible to use Monitorix to just produce static HTML reports or is a webserver with CGI absolutely required?
- What can I do to make Monitorix coexist with Plesk on the same server?
- I have a RAID controller, it is possible to get temperatures using allowed extra parameters in
smartctlcommand? - It's possible to allow the built-in HTTP server to listen to a port below than 1024?
- How can I setup Nginx as a reverse proxy for the built-in HTTP server?
- How can I setup Apache as a reverse proxy for the built-in HTTP server?
- I plan to use other web server than the built-in. What should I take in consideration?
- Why are there so big discrepancies in the values of the graphs sometimes?
- How can I use a manager password with Squid 3.1?
- It's possible to change the default sampling rate of 60 seconds?
- How can I customize the output of 'lm_sensors' to differentiate those exact names?
- Is there an easy way to integrate a ping statistic?
- I want to create my own .pm, is there some kind of documentation?
Troubleshooting
- I just installed Monitorix but I don't see any activity.
- I just installed Monitorix but the graphs are not visible. What's going on?
- Forbidden: You don't have permission to access /monitorix-cgi/monitorix.cgi on this server.
- I've just upgraded my NVIDIA driver and now the GPU usage graph no longer shows any data, What's the problem?
- I'm getting the error message: 500 Internal Server Error (also Malformed header).
- Using the built-in HTTP server I get the following message: The requested URL / was not found on this server.
General
Where can I get Monitorix?
It can be freely obtained from its official website, but you should verify first if your system already provides a ready-to-install package of Monitorix.Can I use it for comercial purposes?
Yes. Monitorix is an open source project and it is released under the GNU License. You don't have to tell me about your products, but if you have a success story about how Monitorix has helped you, I'd love to hear about it.Who is the author of Monitorix?
Jordi Sanfeliu is the author of Monitorix.Is there a mailing list for Monitorix?
Yes. There is a mailing list for general discussion. See the Contacts page for the details.Is there an IRC channel for Monitorix?
Yes. There is a channel at Libera.Chat called #monitorix to discuss about help, bugs and enhancements. See the Contacts page for the details.What are the right steps to upgrade Monitorix on a RHEL/Fedora/Rocky Linux system?
When a new Monitorix version is released and once you had already downloaded it, you may just follow the same steps you'd do it to upgrade practically any other application:
# service monitorix stop
Stopping Monitorix:                                        [  OK  ]

# rpm -Uvh monitorix-n.n.n.noarch.rpm
Preparing...                ########################################### [100%]
   1:monitorix              ########################################### [100%]

# service monitorix start
Starting Monitorix:                                        [  OK  ]
Only in those cases when you modified the original monitorix.conf configuration file, you'll see the following output:
# rpm -Uvh monitorix-n.n.n.noarch.rpm
Preparing...                ########################################### [100%]
   1:monitorix              warning: /etc/monitorix.conf created as /etc/monitorix.conf.rpmnew
   ########################################### [100%]
In such cases please take some time to compare your current configuration file and adapt the new changes on it.
What is the proper way to configure Monitorix?
To avoid having to update the main configuration filemonitorix.conf on every new release, the best way to configure Monitorix is creating your own configuration file in conf.d/ directory (e.g. conf.d/local.conf). This extra configuration file will be loaded right after the main configuration file, so you only need to introduce your changes.
Of course, you need to respect the layout of the main configuration file by naming correctly the sections when they have some changes. That is, a configuration file can contain sections, subsections and even subsubsections in the form of:
<gensens>	<-- this is a section or module name
	<list>		<-- this is a subsection
		0 = temp0
		1 = cpu0
		2 = bat0
	</list>
	...
For instance, imagine you want to monitor a second CPU in the gensens module. You will create an extra configuration file to include a second CPU (cpu1) in the key 1 inside the subsection list. In that case your extra configuration file should define the section gensens as this:
<gensens>
	<list>
		0 = temp0
		1 = cpu0, cpu1
		2 = bat0
	<list>
<gensens>
That is, you must include the main section gensens and the whole subsection list with all the rest of options. The rest of subsections of gensens are not needed because they have not been changed. Monitorix will use the values defined in the main configuration file.
Can be used in non GNU/Linux systems?
Monitorix was initially created to be fully GNU/Linux dependant, but today it might also run on FreeBSD, OpenBSD and NetBSD systems with different level of success.Where can I find more documentation about the options in the configuration file?
For more information about how to configure the different options inmonitorix.conf check the monitorix.conf(5) man page.
What about the .rrd files in /var/lib/monitorix, it's expected that they will grow every day?
Don't worry much about the RRD files in /var/lib/monitorix, they are sized during their creation and their sizes will remain the same during all the time (unless you extend the number of years of historical data using the option max_historic_years). That's not a feature of Monitorix, but a feature of RRDtool.
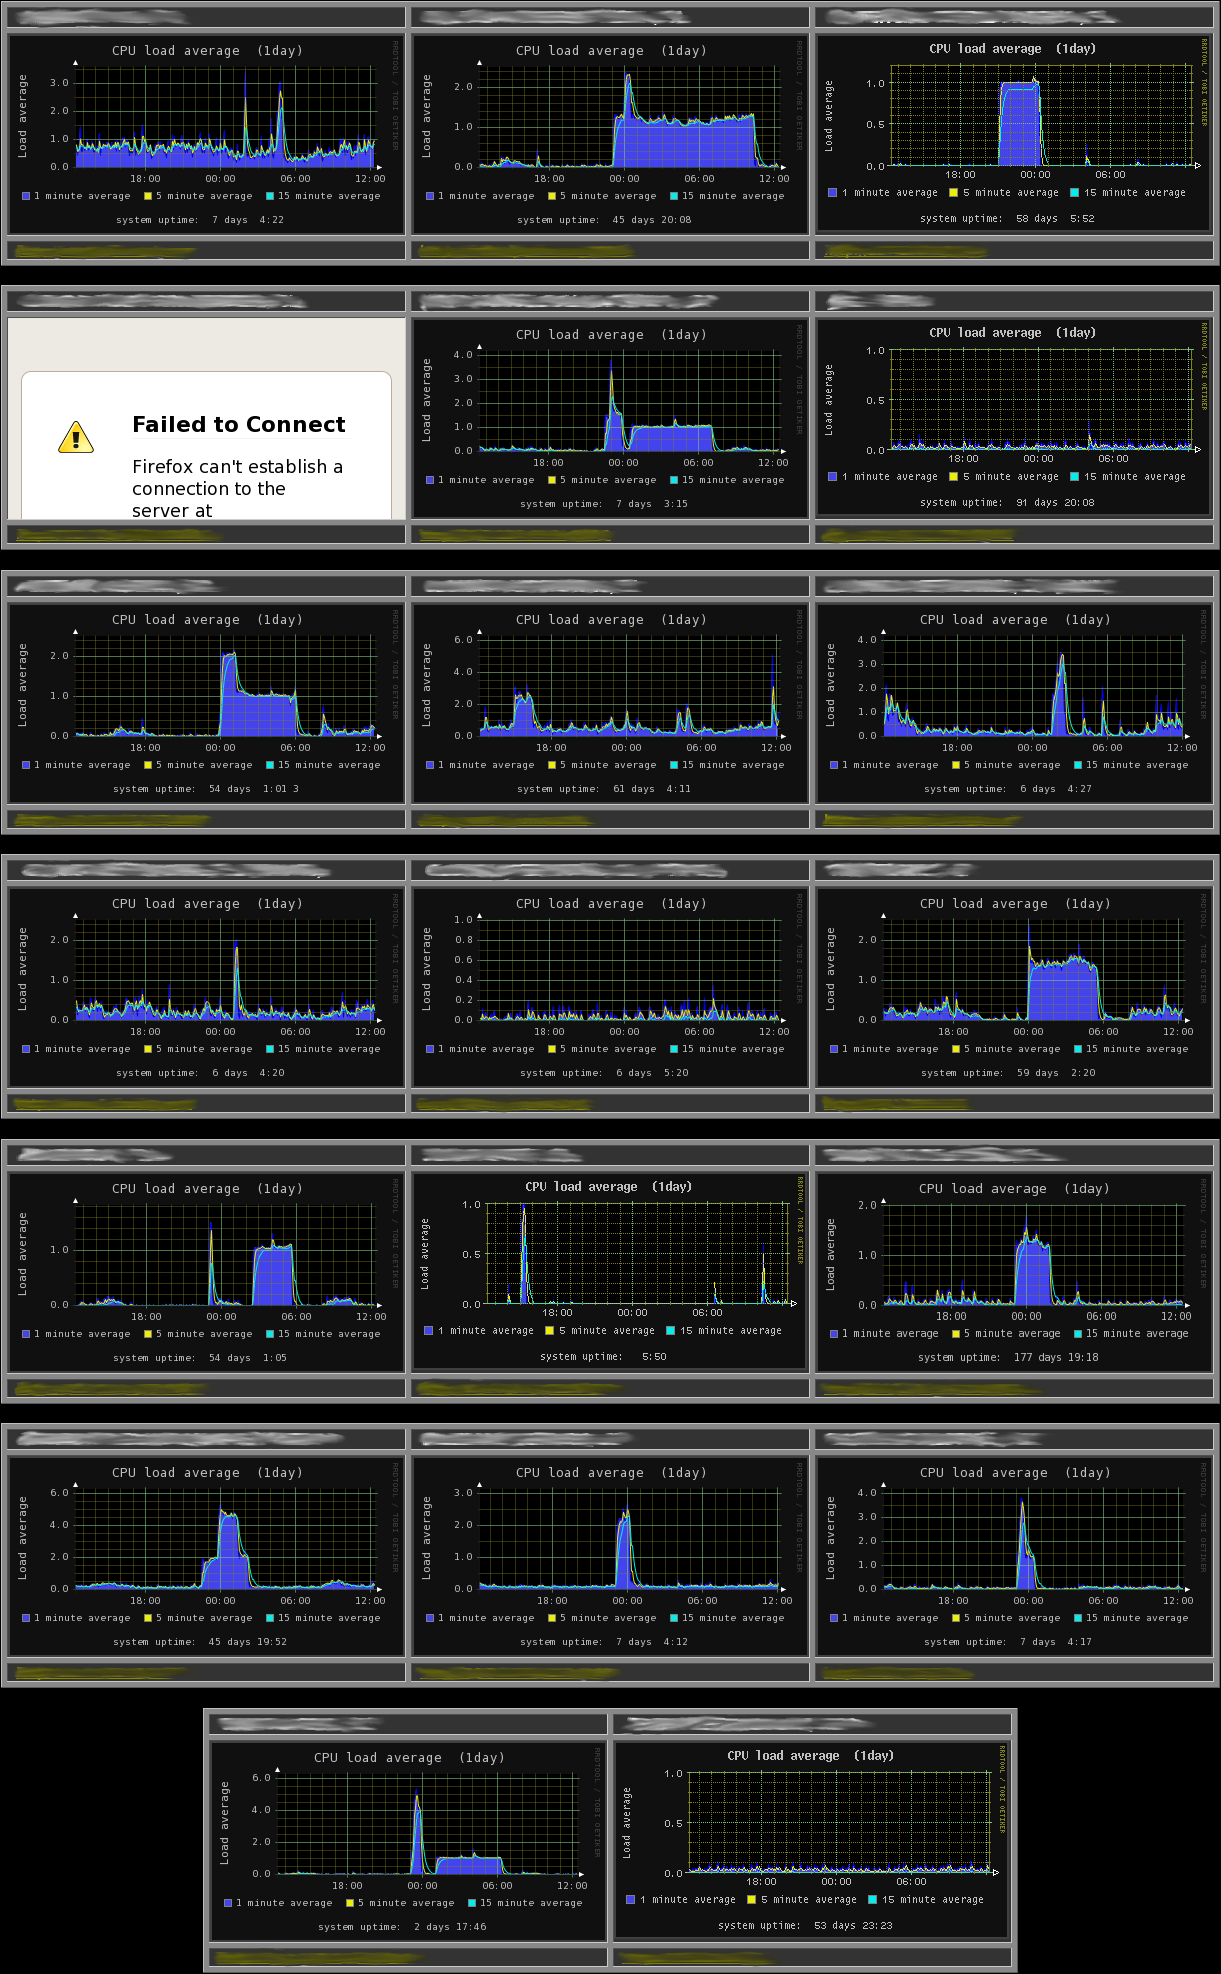
I have a lot of servers, how can I use Monitorix to centralize the statistics?
If you plan to use Monitorix on several servers you will want to use the Multihost feature as you can see in this Monitorix screen shot.These are the steps to setup the Multihost feature.
- First of all you need to install Monitorix in each server you want to monitor.
- Then decide from what server you want to see all the remote graphs.
- Finally modify the following options only in the server chosen to see the remote graphs.
<multihost>
        enabled = y
	...
This will enable the Multihost feature on that machine and it will prepare a suitable web main-page to select your defined servers. Alternatively you can adjust the other Multihost feature related options (that's optional):
	footer_url = y
        graphs_per_row = 2
The first one will show in the bottom line of each graph the URL of the server. If you think this can be dangerous or not recommendable in your LAN, just switch it to n.
The second one is the number of graphs that will appear on each line while monitoring the remote servers. The default is 2 and is a good choice for resolutions up to 1280x1024 to avoid horizontal scrolling. For bigger resolutions you can try other values. The more resolution you have the more images per line you'll like to have.
Finally you need to specify the list of servers you plan to monitor, and you can create such list below in the same configuration file. Like this:
	remotehost_list = server 1, server 2, server 3
        <remotehost_desc>
		0 = http://www.example.com,/montorix,/monitorix-cgi
		1 = http://10.0.0.1,/montorix,/monitorix-cgi
		2 = http://192.168.0.100:8080,/,/
	</remotehost_desc>
After applying those configurations just restart Monitorix and point your browser to your main machine from where you planed to monitor the rest of servers, that is, the same machine where you had configured the /etc/monitorix/monitorix.conf file.
In the Monitorix main page you'll see you'll be able to select your defined servers individually or collectively using All hosts option.
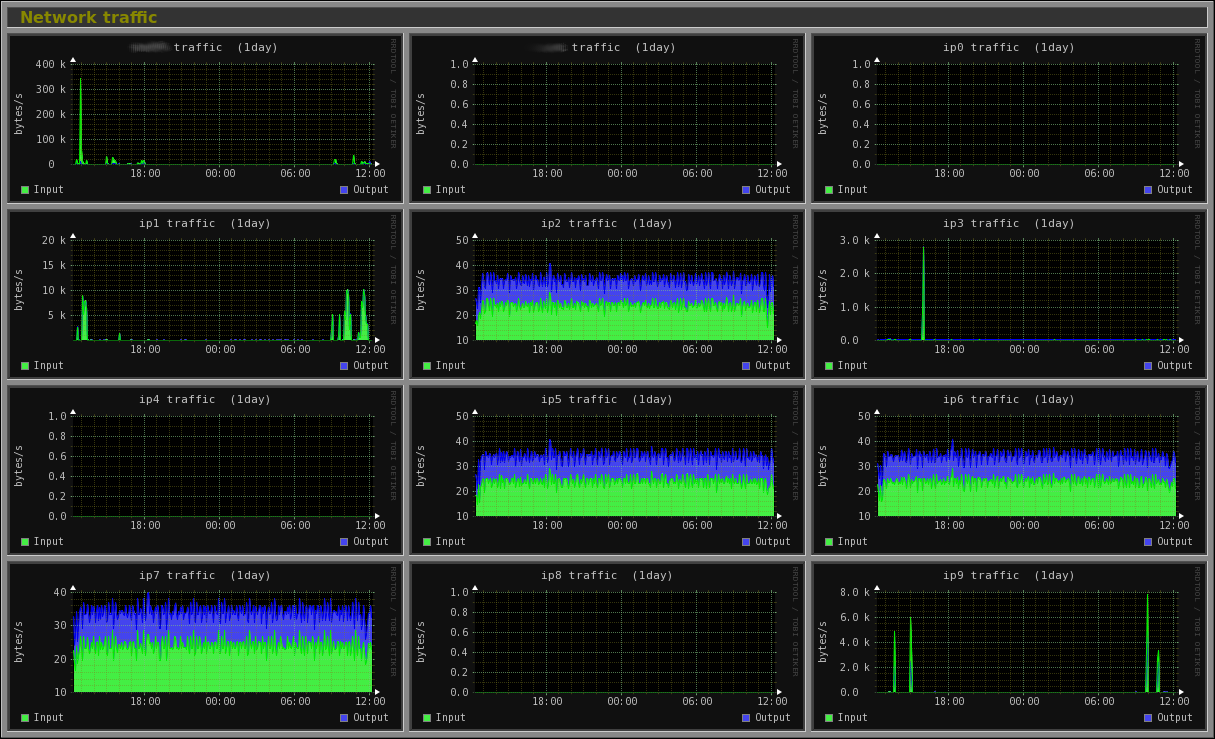
How can I monitor Internet traffic on a gateway server?
If you have a network gateway server and you want to monitor the Internet activity of your LAN devices, you can enable thetraffac module. With this module you can monitor unlimited number of network devices, and even receive monthly reports with the Internet activity of each device configured.
Please, see this screen shot.
How should I interpret the Memory Allocation graph?
Since version 3.11.0 the representation of the Used value in the memory graph has changed. It no longer shows the difference between the fieldsMemTotal and MemFree that appear in the /proc/meminfo file. Instead it now uses the same calculation done by the free command line. That is:
Used = MemTotal - MemFree - Buffers - Cached - SReclaimable - SUnreclaim
So, now the red color indicates the real memory being used in your system.
For more information click here.
How should I interpret the Memory Allocation graph? (for versions before 3.11.0)
In GNU/Linux systems the term Memory Used includes the one used by the user applications, the I/O buffers, and other types of cache. The importance here is that the user applications have enough memory all the time, otherwise people tends to complain as soon as they see their applications running slower. To accomplish this, the Linux kernel balances its memory between buffers, cache and user applications, having the later the higher priority when they need more memory.So, you should expect to see all the time the memory Used as higher as possible, which will means that your system is correctly using all its memory for all the purposes, including disk buffers, reducing the number of disk reads and at the same time, and extending the life of your disk(s).
We can conclude that all the memory that is not being used by the user applications, is free. So, in order to know how much of free memory the system has, you must add the amount of memory in green and white colors, because they are used by the buffers and cache. Or said in the other way around, the less red color you see in the graph the more free memory your system has.
For more information click here.
Is it possible to use Monitorix to just produce static HTML reports or is webserver with CGI absolutely required?
Ideally the best way is to use the built-in HTTP server or to have installed an Apache (or any other web server) with CGI enabled.
Anyway and due its Perl script nature, you can execute monitorix.cgi directly from the command line (with the correct parameters), and you'll get the same HTML file as if it was executed by the web server. Don't forget to change to the <base_dir>/cgi directory first.
For example, if you want to see all daily graphs of your localhost, you'd execute the following from the command line:
./monitorix.cgi mode=localhost graph=all when=day color=black
This will output the same HTML file that your broswer would get if there was a web server in the other side.
Remember that the script will generate (among of the HTML code) the rendered graphs and it will try to use the directories defined in the /etc/monitorix.conf file, so make sure that it has enough permissions to write there.
What can I do to make Monitorix coexist with Plesk on the same server?
This is only in case you aren't using the built-in HTTP server.If you contracted a cheap dedicated server and it comes with Plesk already installed, you should know that this admin tool likes to take over all your server. This is the reason why you are able to see only the Monitorix main page, and just after click in the "Ok" button, you get a webserver error preventing you seeying the Monitorix graphs page.
This annoying behaviour can be solved adding a new listening port just inserting a single line in the /etc/httpd/conf.d/monitorix.conf file:
Listen 81
or whatever the port number you like.
In fact, the default configuration of Plesk takes control over the ports 80 and 443 of your webserver, so it won't conflict with any other port that your webserver is listening on.
The second alternative is inserting a new Virtualhost section using the real name of your server:
<Virtualhost your.hostname.com:80>
	DocumentRoot /var/www/html
	<Directory "/var/www/html">
         	# Put this if you really need all options?
		Options Indexes ExecCGI FollowSymLinks MultiViews
		AddHandler cgi-script .cgi
		# are you using .htaccess files? if not, set it from all to none
		AllowOverride all
		Order allow,deny
		Allow from all
	</Directory>

	ScriptAlias /cgi-bin/ "/var/www/cgi-bin/"
	<Directory "/var/www/cgi-bin/">
		AllowOverride None
		Options None
		Order allow,deny
		Allow from all
	</Directory>
</Virtualhost>
The advantage of this second alternative is that you continue using the standard HTTP port.
NOTE: Adjust the above paths and options according your system security.
I have a RAID controller, it is possible to get temperatures using allowed extra parameters in smartctl command?
Yes, if you have a RAID controller such as Smart Array, 3ware, Areca, HighPoint, MegaRAID, etc. and it's supported by your smartmontools version, you may use the same extra parameter you'd put in your smartcl command.
E.g.: if your RAID controller is an Smart Array (using the CCISS driver), you may able to define the following option in monitorix.conf file:
	<list>
		0 = "/dev/cciss/c0d0 -d cciss,0", /dev/sda
	</list>
It's possible to allow the built-in HTTP server to listen to a port below than 1024?
Yes it is, but due to security reasons only theroot user is able to bind ports below 1024 on GNU/Linux. Anyway, you can always workaround this limitation by just redirecting the low port to a high port and listen on the high port:
iptables -t nat -A PREROUTING -i eth0 -p tcp --dport 80 -j REDIRECT --to-ports 8080
How can I setup Nginx as a reverse proxy for the built-in HTTP server?
If you have enabled the built-in HTTP server but you want to use Nginx to access the Monitorix graphs, then you need to append the following lines in theserver {...} section:
location /monitorix {
#    auth_basic "Restricted";
#    auth_basic_user_file /etc/monitorix/monitorix-users;

    include proxy_params;
    proxy_pass		http://127.0.0.1:8080/monitorix;
    allow		127.0.0.0/8;

    # for old versions up to 3.4.0
#    location ~* \.png$ {
#	root /usr/share;
#    }

    # since 3.5.0 version
    location ~ ^/monitorix/(.+\.(css|png))$ {
        alias /var/lib/monitorix/www/$1;
    }
}
How can I setup Apache as a reverse proxy for the built-in HTTP server?
If you have enabled the built-in HTTP server but you want to use Apache to access the Monitorix graphs, then you need to setup yourVirtualHost as this:
<VirtualHost *:80>
     ServerAdmin me@mydomain.com
     ServerName monitorix.mydomain.com
     ProxyRequests Off

     # setup the proxy
     <Proxy *>
         Order allow,deny
         Allow from all
     </Proxy>
     ProxyPass  "/" "http://mydomain.com:8080/"
     ProxyPassReverse "/" "http://mydomain.com:8080/"
</VirtualHost>
Also you might need to add the following option in your <httpd_builtin> section:
url_prefix_proxy = monitorix.mydomain.com
I plan to use other web server than the built-in. What should I take in consideration?
If you prefer to use a different web server than the built-in one, you should take the following steps:- If you have chosen the Apache server then you may want to use the file
monitorix-apache.confas a starting point to configure an Alias to point to Monitorix. - If you have chosen the Nginx server then I recommend you to read the nice HOWTO of Bernhard Ehlers.
- If you have chosen the Lighttpd server then you may want to use the file
monitorix-lighttpd.confas a starting point to configure it to point to Monitorix. - In any case, make sure the directory
/var/lib/monitorix/www/imgs/and its contents have enough write permissions for the user/group that your web server will run as. - Disable the built-in HTTP server in
monitorix.confand restart Monitorix.
Why are there so big discrepancies in the values of the graphs sometimes?
Different sizes of graphs have different resolutions. This is best explained using a fictive example: where the small graph would cover 2 minutes for an estimation value, the larger scaled graph would have a finer resolution, let's say 1 minute. So 7 hits in the first, and 3 hits in the second minute would show a peak of 7 in the large graph (from the first minute), while the smaller graph would show an average of 5, (7+3)/2.How can I use a manager password with Squid 3.1?
Squid 3.1 and 3.2 have different syntax if you want to use a manager password to get the statistics. Monitorix already supports the syntax for Squid 3.2, this is accomplished by using thecmd option of the Squid graph in the Monitorix configuration file. The syntax would be:
squidclient -h 127.0.0.1 -u manager -w secret_password
But if you have a Squid 3.1 version and you still need to pass a password to manager, the syntax is different and is not currently supported by Monitorix. In that case, the cmd option will have a half of the complete command and the rest must be patched directly in the code:
squidclient -h 127.0.0.1 -u manager
Then, you need to locate and patch the following lines in the /usr/lib/monitorix/squid.pm module to complete the command syntax:
open(IN, "$squid->{cmd} mgr:counters\@secret_password |");
open(IN, "$squid->{cmd} mgr:info\@secret_password |");
open(IN, "$squid->{cmd} mgr:ipcache\@secret_password |");
open(IN, "$squid->{cmd} mgr:io\@secret_password |");
open(IN, "$squid->{cmd} mgr:storedir\@secret_password |");
It's possible to change the default sampling rate of 60 seconds?
No, you cannot change the sampling rate. It has a fixed value which is intrinsically related to the internal structure of the.rrd files.
How can I customize the output of 'lm_sensors' to differentiate those exact names?
Sometimes the output oflm_sensors shows the same exact names for different temperature values and so Monitorix is unable to differentiate them. If you are under this situation please check the issue #131 to solve this situation.
Is there an easy way to integrate a ping statistic?
Monitorix currently lacks of an specific module to monitor pings or any other user command. Nonetheless, you could accomplish this by hacking a bit thegensens module. Since this module is focused on monitoring devices: temperatures, voltages, etc., and since it reads the values from a file, one could emulate a new 'ping' sensor by taking the value from the command ping.
You just need to create a cron job (on every minute) to execute a command like this one (thanks to Martin Strasser for improving it):
sleep 10 ; ping -c 5 -nq 8.8.8.8 | tail -1 | awk '{if ( $4 == "" ) { print "0/0/0/0" } else { print $4}}' | awk -F / '{print $2 }' > /tmp/ping0_results.txt
This command (hopefully) will get the average statistic value (in milliseconds) after 5 pings to 8.8.8.8. The initial sleep 10 helps Monitorix to read the file with the previous value before it gets truncated by the Bash redirection operator.
Finally you just need to configure and enable the gensens module like this:
# GENSENS graph
#
# -----------------------------------------------------------------------------
<gensens>
	<list>
		0 = temp0
		1 = temp1
	</list>
	<title>
		0 = Pings
		1 = Pings
	</title>
	<desc>
		temp0 = /tmp/ping0_results.txt
		temp1 = /tmp/ping1_results.txt
	</desc>
	<unit>
		temp0 = 1
		temp1 = 1
	</unit>
	<map>
		temp0 = ping to 8.8.8.8
		temp1 = ping to 8.8.4.4
	</map>
	<alerts>
	</alerts>
	rigid = 0, 0, 2
	limit = 100, 100, 100
</gensens>
In this example there are configured two different pings in order to let you know that you can configure several different pings graphs.
Unfortunately, Units (Hz,...) must be changed in the source code.
I want to create my own .pm, is there some kind of documentation?
There isn't much documentation of how to create your own Monitorix Perl module (.pm), but this shouldn't prevent you from create your own. All the .pm are developed following the same structure to avoid complexity and to be easily understandable.
So, take the module that better fits your needs and use it as a starting point, just as Jehan PROCACCIA did. Please, take a look to his HOWTO on how he created his own .pm here.
Troubleshooting
I just installed Monitorix but I don't see any activity.
The Monitorix graphs takes a few minutes to start showing activity. Please be patient.I just installed Monitorix but the graphs are not visible. What's going on?
If you only see the skeleton page without the graphs, it probably means that your web server don't have enough permissions to write into the<base_dir>/imgs directory.
Forbidden: You don't have permission to access /monitorix-cgi/monitorix.cgi on this server.
If you are using Apache as your web server, then it's possible that the configuration file for Apache that comes with Monitorix is too much restrictive.Please edit the Apache configuration file that comes with Monitorix which is located in:
/etc/httpd/conf.d/monitorix.conf(for RedHat and derivative systems)./etc/apache2/conf.d/monitorix.conf(for Debian and derivative systems).
<Directory /var/lib/monitorix/www/cgi/>
         DirectoryIndex monitorix.cgi
         Options ExecCGI
         order deny,allow
         deny from all
         allow from 127.0.0.1
</Directory>
Just change the last option by something wider like this:
allow from all
And restart Apache for the changes to take effect:
# service httpd restart
I've just upgraded my NVIDIA driver and now the GPU usage graph no longer shows any data, What's the problem?
If you upgraded to a newer NVIDIA driver 270.+ thenvidia-smi tool no longer displays a complete information as it did with the older drivers. So this is the reason why Monitorix is unable to gather the GPU usage information.
You may want to read a pair of posts in some forums here and here.
I'm getting the error message: 500 Internal Server Error (also Malformed header).
This is probably because you are using an external web server (Apache, Lighttpd, Nginx, etc.) while at the same time you have enabled the Monitorix built-in HTTP server.
Edit the /etc/monitorix/monitorix.conf file, and switch to n the enabled option:
<httpd_builtin>
	enabled = n
	...
And don't forget to restart Monitorix.
Using the built-in HTTP server I get the following message: The requested URL / was not found on this server.
You are getting this error because the URL you use to connect with Monitorix doesn't match with the values setup in the optionsbase_url and base_cgi in the configuration file.
You must setup these options according to the URL that you are using to connect with Monitorix. That is, if you want to use the default URL:
http://localhost:8080/monitorix/
then you need to setup the following values:
base_url = /monitorix
base_cgi = /monitorix-cgi
In the other hand, if you want to use the following URL:
http://localhost:8080/
then the values must be setup as:
base_url = /
base_cgi = /


